Report 52: Nine Months Post-COVID mRNA “Vaccine” Rollout, Substantial Birth Rate Drops in 13 European Countries, England/Wales, Australia, and Taiwan.
Robert W. Chandler, MD, completed extensive research to write the article below. Some of the highlights of this important piece include:
- Nine months following the rollout of the COVID-19 mRNA “vaccines,” substantial birth rate drops were seen in 13 of 19 European countries, England and Wales (one entity based on how data is published), Australia, and Taiwan.
- The decline in births in Switzerland was the largest in 150 years – more than during two World Wars, the Great Depression, and the advent of widely available birth control.
- There was an 8.3% drop in the birth rate in Germany through three quarters of 2022.
- England and Wales had a 12% birth rate drop through June 2022, which is when their government stopped publishing data related to this.
- Taiwan reported an alarming birth rate drop, but its data are incomplete.
- Australian birth rates fell 21% from October to November 2021, followed by a 63% decrease from November to December 2021.
- On August 25, 2022, the Swiss Hagemann group published a statement regarding the decline of live births in Europe: “My analysis puts the monthly birth figures in relation to the average of the last three years. In advance it should be noted that every single examined European country shows a monthly decline in birth rates of up to more than 10% compared to the last three years. I can be shown that this very alarming signal cannot be explained by infections with Covid-19. However, one can establish a clear temporal correlation to Covid vaccinations incidence in the age group of men and women between 18 and 49 years. Therefore, in-depth statistical and medical analyses have to be demanded.” [https://www.initiative-corona.info/fileadmin/dokumente/Geburtenrueckgang-Europe-EN.pdf]
I. Background
Pfizer’s “Preclinical Studies, 2.4 Nonclincial Overview” revealed concentration of lipid nanoparticles containing experimental mRNA in ovaries of Wistar rats. [https://www.phmpt.org/wp-content/uploads/2022/03/125742_S1_M2_24_nonclinical-overview.pdf] The study was completed in 48 hours. Unfortunately, the tissue levels of lipid nanoparticle and mRNA were rising sharply at the time the animals were sacrificed, and the biodistribution time course of LNP and mRNA remains largely unknown. [https://robertchandler.substack.com/p/tissue-distribution-of-bnt162b2-pre and https://dailyclout.io/pfizer-used-dangerous-assumptions-rather-than-research-to-guess-at-outcomes/]
There has been no evidence located to date in the Pfizer records that necropsy examinations with special staining of ovarian tissues for spike proteins under light and electron microscopy were performed, which is an important omission. Additional animal studies were indicated but were not performed. Deficiencies were reviewed previously. [https://robertchandler.substack.com/p/pfizer-pre-clinical-studies-review]
Sasha Latypova in a January 1, 2023, review of Pfizer’s Pre-Clinical (Pfizer document 2.4) testing concluded:
“The cursory nature of the entire preclinical program for mRNA injections conducted by Pfizer can be briefly summarized as “we did not find any safety signals because we did not look for them”. The omissions of standard safety studies and glaring scientific dishonesty in the studies that were performed are so obvious that they cannot be attributed to the incompetence of the manufacturers and regulators. Rather, the questions of fraud and willful negligence should be raised.”
https://sashalatypova.substack.com/p/did-pfizer-perform-safety-testing
Additional omissions occurred in Pfizer’s clinical trials:
- Critically, the Phase 2/3 Clinical Trial (Polack, et al.) involving over 40,000 subjects did not include pregnant women, at least not by design. A small number of pregnant women were injected, but no follow-up reporting on these women was provided.

https://www.nejm.org/doi/pdf/10.1056/NEJMoa2034577?articleTools=true
- A 12/22/2022 paper by Irrarang, et al. identified dose-related effects in the distribution of IgG profile in humans after the second and third doses of Pfizer’s SARS-CoV-2 mRNA drug (BNT162b2):

https://www.science.org/doi/10.1126/sciimmunol.ade2798
Figure 1: Dose-Related Shift in IgG Immunoglobulins.

Dose-related shift in IgG profile with decline in IgG 1 and 3 and rise in IgG 2 and 4 with increasing doses of LNP/mRNA.
Figure 2: Gain in IgG 4 As the Number of LNP/mRNA Doses Increase
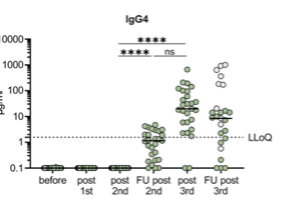
Figure 2 is a plot of the rise in IgG4 with successive doses of BNT162b2 after Dose 2. The significance of this IgG shift is only beginning to be explored. What is certain is that alteration of the IgG profile was not anticipated and therefore not studied.
Jessica Rose discusses these findings in the context of pregnancy noting:
“IgG can be passed to the foetus via the placental barrier via endosomes “within syncytiotrophoblasts of the placenta, through a pH dependent mechanism involving FcRn receptors, with a possible role for other IgG Fc receptors, yet to be fully elucidated”. They also showed a preferential transfer of IgG4 (and IgG1 and IgG3). Right. So (sic) what is the effect, therefore, on the foetus when there is a dramatic shift in IgG subclass ratio to subclass IgG4? I cannot imagine that the effects would be nil.” (Italics added)
https://jessicar.substack.com/p/igg4-and-pregnancy
- Röltgen, et al. dispelled the notion that the LNP/mRNA products briefly remain at the injection site and in local lymph nodes when they identified mRNA in local lymph nodes for two months after injection, at which point the study ended. So, it is unknown how long mRNA persists, where it is located, what it does to the host genome, and for how long it produces a largely unidentified artificial protein(s). [https://www.cell.com/cell/fulltext/S0092-8674(22)00076-9]
- Long-term data is limited at present but is accruing. The studies promised by Pfizer and the Centers for Disease Control and Prevention (CDC) have not appeared.
- The control group that was meant to be followed for two years was unblinded after a few months, which contaminated the group. Eliminating the control group was tragic decision.
II. Recommendations During Pregnancy
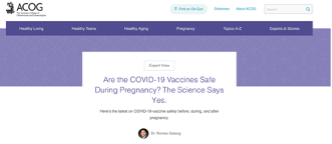
Remarkably, in spite of concentration of both lipid nanoparticles and mRNA in the ovaries of experimental animals, dose-related effects in animals and humans, and no testing in pregnant women during clinical trials or surveillance following the Experimental Use Authorization (EUA) granted by the Food and Drug Administration (FDA) December 14, 2020, the Centers for Disease Control and Prevention (CDC) and the American College of Obstetrics and Gynecology (ACOG) have recommended use of LNP/mRNA products in pregnant women without knowledge of either the short-term or long-term effects of what is contained in the vials of LNP/mRNA and their effects on the human reproductive system.
![]()

(Accessed 12/29/2022.)
III. Post-Emergency Use Authorization (EUA) and Pregnancy
Widespread injection of the American population began in mid-December of 2020. Almost immediately Pfizer had to initially hire 600 hundred, then an additional 1400, extra personnel to document the tsunami of adverse event reports following administration of BNT162b2, the Pfizer LNP/mRNA therapeutic. [https://thetruedefender.com/just-in-pfizer-hires-additional-1800-employees-to-process-adverse-reactions-to-the-c-19-vaccine/]
Over 42,000 individuals experienced adverse events in the first 10 weeks after the December 2020 EUA. Cumulatively, through February 28, 2021, there were “42,086 case reports (25,379 medically confirmed and 16,707 non-medically confirmed) containing 158,893 events.” [https://drjessesantiano.com/pfizer-bnt162b2-adverse-events-as-of-february-2021-after-the-roll-out/]
Of those, 72% involved women. [https://robertchandler.substack.com/p/cdcfda-safety-evaluation-in-pregnant and https://dailyclout.io/data-do-not-support-safety-of-mrna-covid-vaccination-for-pregnant-women/] Furthermore, 16% of the adverse events involved the reproductive organs and functions. [https://robertchandler.substack.com/p/why-do-females-have-more-adverse and https://dailyclout.io/women-have-three-times-the-risk-of-adverse-events-than-men-risk-to-the-reproductive-organs-is-even-greater-report/]
In 2021, no definitive data was collected, particularly properly powered prospective cohort studies of pregnant women and their babies. The CDC and FDA made an attempt to use a call-in reporting system, called v-safe, to determine an outcome for these women but the effort was a failure. [https://robertchandler.substack.com/p/cdcfda-safety-evaluation-in-pregnant and https://dailyclout.io/data-do-not-support-safety-of-mrna-covid-vaccination-for-pregnant-women/]
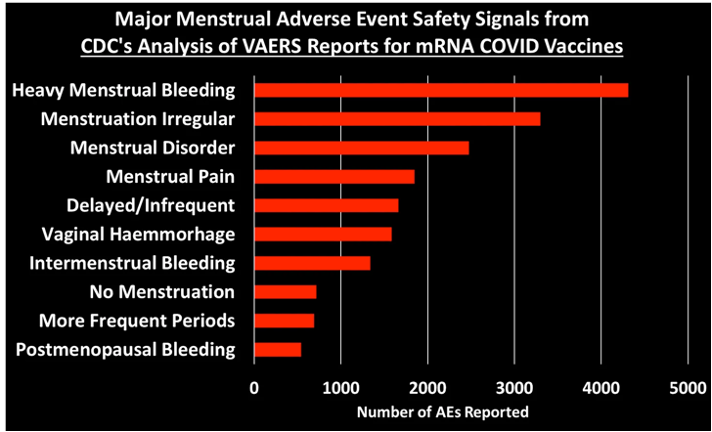
Josh Guetzkow presented a graphical representation of data released by the CDC after a Freedom of Information Act (FOIA) request from The Epoch Times and reported by Zachary Stieber: https://childrenshealthdefense.org/defender/cdc-safety-signals-pfizer-moderna-covid-vaccines-et/ and https://jackanapes.substack.com/p/cdc-finally-released-its-vaers-safety]
Chart 1: VAERS Report 12/14/2020 – 7/29/2022
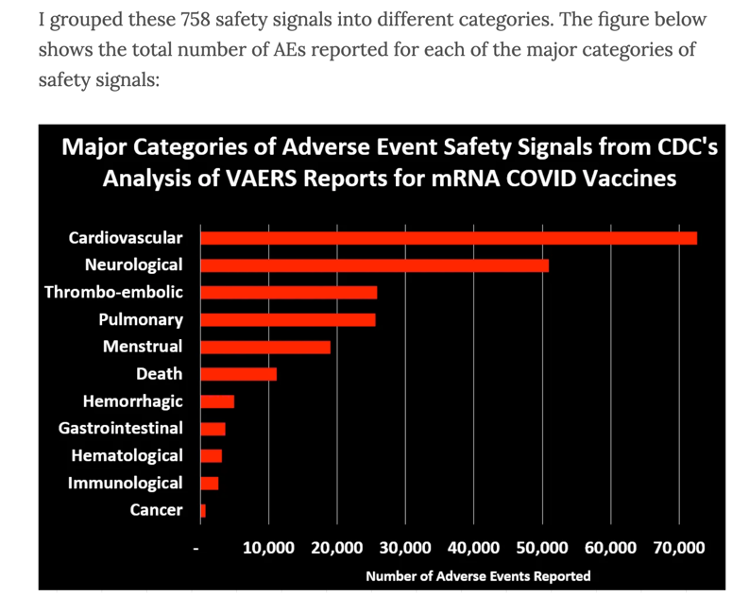
There were almost 20,000 reported cases of menstrual problems after LNP/mRNA injections. It is not known for certain how many cases go unreported. The Vaccine Adverse Events Reporting System (VAERS) reporting is arduous and unfamiliar to some or many health care providers. So, 20,000 could easily represent exponentially more.
Chart 2: Menstrual Irregularities after LNP/mRNA
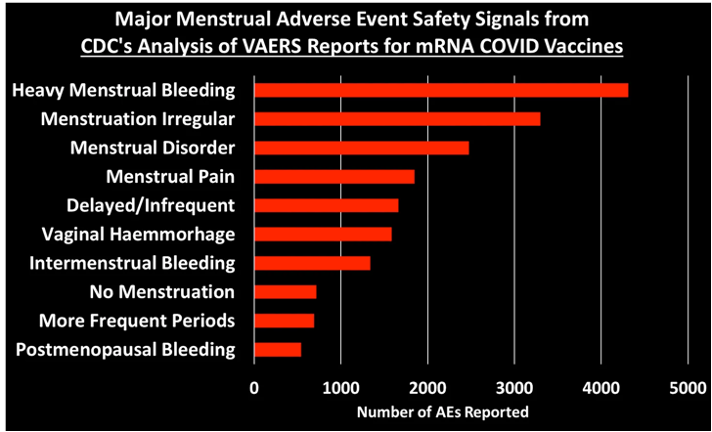
These disturbances might show up as a decline in births nine months later. We will not know for some time whether there are permanent alterations in fertility from LNP/mRNA.
Although data are accruing slowly, there remains a substantial information void concerning spontaneous abortion, stillbirth, preterm birth, small size for gestational age, congenital anomalies and neonatal adverse events. [https://robertchandler.substack.com/p/misinformation-cdcfda-style-retroactive and https://dailyclout.io/report-40-2021-cdc-and-fda-misinformation-retroactive-editing-erroneous-spontaneous-abortion-rate-calculation-obfuscation-in-the-new-england-journal-of-medicine/]
IV. Birth Rates following Rollout of the LNP/mRNA Products in 22 Countries
Time has brought forth data pertinent to the question of whether the LNP/mRNA products, and specifically Pfizer’s BNT162b2, impair fertility. It now appears that LNP/mRNA products are associated with a decline in live births, the subject of this article.
Time series data will be presented making generous use of graphical presentation of data from Australia, Taiwan, and England/Wales (considered one country as the data are combined). Statistical analysis of data from 19 European countries will then be examined.
Caution here is advisable. Population studies have many technical issues, some identifiable and some not. There are numerous challenges to diligent and accurate capture and distribution of data from hundreds or thousands of primary sources in a timely and consistent manner.
Published data often must be revised later as the flow of data matures. Data collecting details vary widely in different countries. Sometimes numbers will vary according to when data collection periods are closed.
Sadly, the possible role of governments in falsifying data or obstructing the flow of data for political purposes must be kept in mind.
V. Live Birth Patterns in 22 Countries
The following sections will examine changes in birth rates relative to the rollout of LNP/mRNA using simple, descriptive statistics and visual representations of data for England/Wales, Australia, and Taiwan. These data are examined in the context of short-term changes in birth rates to get a sense of change in birth rate following widespread use of LNP/mRNA.
Data from European countries will be examined using the Spearman Rank Order statistic to measure correlation between the administration of LNP/mRNA and changes in birth rates.
[https://fbf.one/wp-content/uploads/2022/09/Geburtenrueckgang-Europe-EN.pdf]
Data from Switzerland (Group 1, high correlation and very high statistical significance) will be examined using both the Spearman Rank Order statistic by Hagemann, et al. as well as the Difference in Differences method as reported by Beck and Vernazza.
[https://transition-news.org/IMG/pdf/geburtenrueckgang-in-den-schweizer-kantonen_13082022.pdf and https://www.aletheia-scimed.ch/wp-content/uploads/2022/08/Geburtenrueckgang-in-den-Schweizer-Kantonen_13082022.pdf]
This section will then conclude with examination of outliers.
A. England and Wales
Chart 3: Declining Birth Rate 2008-2021
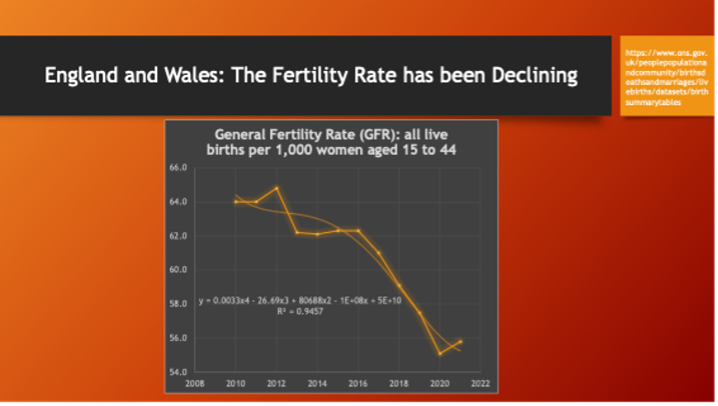
The 13-year pattern of declining birth rate in England/Wales is illustrated above in Chart 3. Note the uptick at the end of 2020 going into 2021 that may indicate the effect of lockdowns and then release from lockdowns.
The task, using population data showing this pattern of long-term decline, will be to identify acceleration (second derivative) in this decline.
Chart 4, below, examines this uptick in 2021 in the followed by a reversal of the 2021 uptick in 2022.
Chart 4: Close-Up Detail of Births from January 2021 Through June 2022
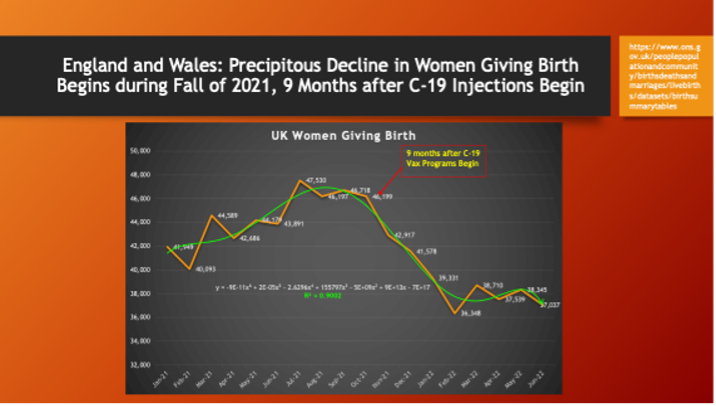
The uptick in births in 2021 was rapidly reversed during the months of September through November of 2021, approximately nine months after the widespread release of COVID-19 vaccines.
Chart 5: The Decline in Births Month-to-Month Compared with 2021
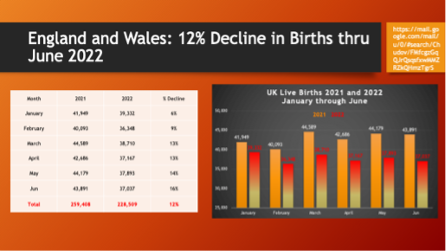
The decline in births appears to be accelerating according to these data.
The United Kingdom Security Agency publishes live birth data. The report is issued monthly, but the live birth data has not been updated since June 2022.
B. Australia
Chart 6: Australia Pattern of Births 2000-2021
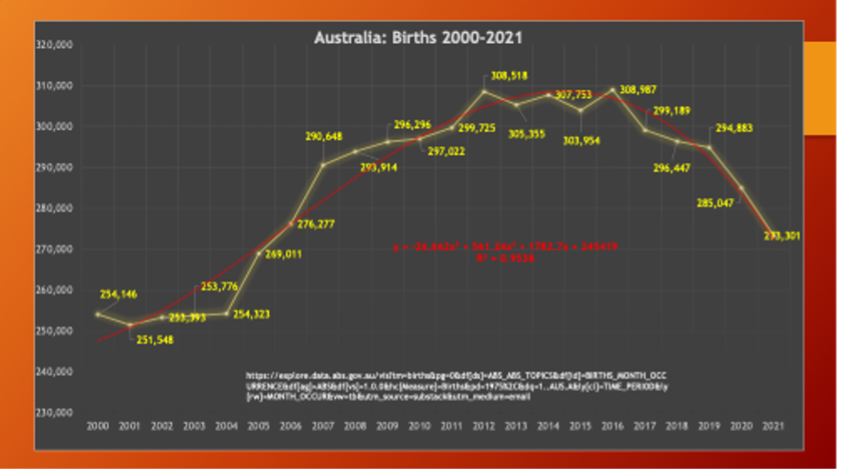
Birth rates in Australia were increasing until hitting a plateau during 2012-2016. Then there was a period of decline leading into the COVID-19 era.
Chart 7: Births in Australia from 2016-2021
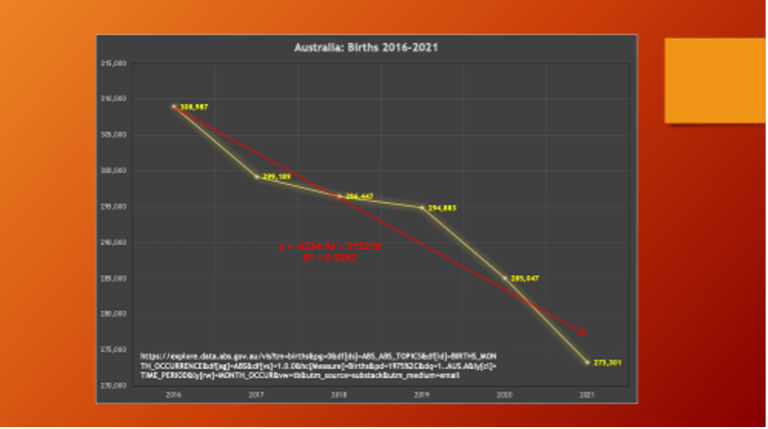
A closer look at the decline from 2016 to 2021 shows decline with a high degree of linearity.
Chart 8: Australia: Acceleration in Decline of Births
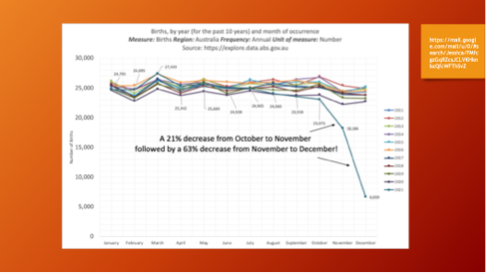
This chart, prepared by Jessica Rose, shows a nosedive in births like that seen in the England/Wales data, accelerating decline in births beginning approximately 9 months after the implementation of C-19 mRNA gene products. [https://jessicar.substack.com/p/whats-going-on-with-births-down-under]
The decline in October and November of 2021 is dramatic. Anomalies in the data collection and reporting process should be ruled out as the cause of this large drop-off in births. These figures need to be revisited from time to time to see if what began as menstrual irregularity is the first sign of infertility.
C. Taiwan
Chart 9: Births/1,000 in Taiwan 1958 – 2020
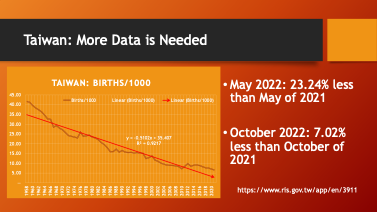
A government report indicated a drop-off in births per thousand in 2022, but a full data set needs to be located. The long-term trend in declining births is again illustrated but with possible acceleration in 2022 following widespread COVID immunization in 2021.
After this chart was made, the following data appeared on Wikipedia cited with reference [52] (in Mandarin). Through November 2022, there was a decline in live births of 9.22%; 12,885 expected babies did not arrive. The birth rate has been substantially below what is necessary for replacement. Now there are decreasing births and increasing deaths exacerbating the decline.
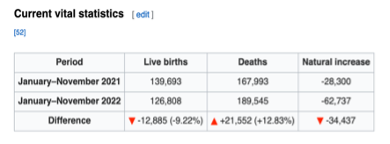
[https://en.wikipedia.org/wiki/Demographics_of_Taiwan#Fertility_rate]
The accelerating decline in births in England/Wales, Australia, and Taiwan following widespread administration of LNP/mRNA gene therapy products is disconcerting and points to an association between LNP/mRNA gene therapy and acceleration in the declining rate of birth. Taiwan has more to worry about than the People’s Liberation Army.
D. Europe
Chart 10 below is a visual representation of 60 years of births/1,000 in the European Union. The long-term declining trendline has a high degree of linearity.
Sixty years of declining births needs to be taken into consideration when looking at short-term changes.
Chart 10: Long-Term Births/1,000 in Europe
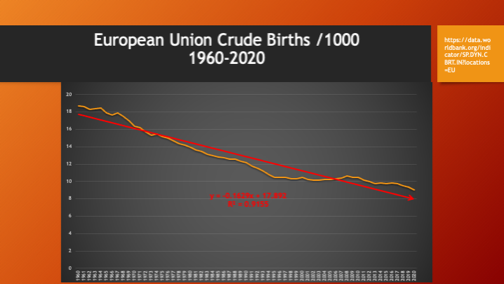
Large and abrupt changes in short-term births rates is one indicator of a causative relationship between LNP/mRNA and declining birth rates.
Hagemann, Lorré and Kremer Analysis
On August 25, 2022, Raimund Hagemann, Ulf Lorré, and Dr. Hans-Joachim Kremer published a detailed, 91-page report on their analysis of live birth data from 19 European countries. Their report contains detailed data and analysis and is well worth reading. [https://www.aletheia-scimed.ch/wp-content/uploads/2022/08/Geburtenrueckgang-Europe-DE_25082022_2.pdf]
Most of the following section, Europe, will present data from Hagemann, et al., and the citation above applies unless otherwise specified.
Hagemann et al. used the Spearman Rank Order statistic to compare the correlation between the rank of birth rate change with the rate of injection of LNP/mRNA in persons ages 18 to 49. The correlation coefficient is represented by rho (r).

This statistic converts continuous data into ranks or categories before calculating the correlation between the two ranks.
The authors offer the following guides to the interpretation of the results.
Interpretation Guidelines:
Correlation: The degree of association between the rate of LNP/mRNA injection and the rate of change in births represented by rho. From Hagemann, et al.:

Statistical Significance: The degree of probability that the correlation deviates from random chance is expressed by the p-value. In medicine p-values less than 0.05 or 95% chance that the correlation is non-random are usually considered to be statistically significant. Hagemann, et al. considered a p-value <0.001 to be highly significant.

Table 1 below presents the summary data from Hagemann, et al. for 19 European countries.
Table 1: Births and Vaccination Rates in 19 European Countries.
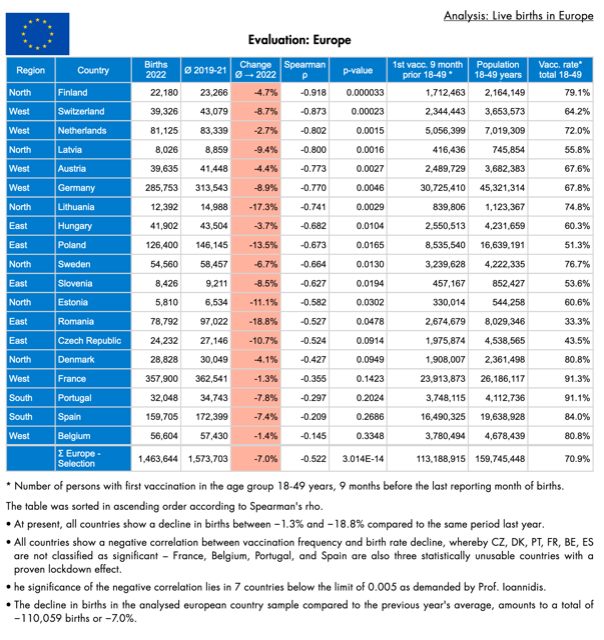
Hagemann, et al. kindly highlighted a key statistic with orange coloring. Note that all 19 countries registered declining birth rates through June 2022. Continuing to be helpful, the authors ranked the countries according to the degree of correlation and statistical significance of the association between the percent of the population ages 18 to 49 who received LNP/mRNA products and the rate of live births.
The comments below the data table in Chart 9 note the decline in birth rate in all 19 countries ranging from -1.3% in France to -18.8% in Romania. Note also that 68% (13/16) of the countries, Romania and above, had Spearman rho values of -0.527 or higher with p-values less than 0.05, which indicates very strong support for causation attributable to LNP/mRNA injections.
The association between LNP/mRNA inoculation rate and the rate of decline was closely examined in each country with the overall conclusion that there was a statistically significant association between the two rates but with a negative association, as the vaccination rate increased as the birth rate declined. Furthermore, the decline followed nine months after the rollout of the LNP/mRNA inoculation program. The decline was not associated with COVID-19.
Chart 11 below is a combination plot of the change in births in yellow and the rate of inoculation with LNP/mRNA products in orange for all 19 countries.
Chart 11: Percent Immunized (Orange) and Percent Decline in Births (Yellow).
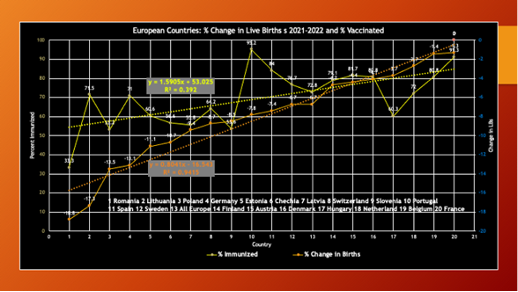
Countries are numbered and listed below the plots. The birth rate decline data indicates a high degree of linearity (R2 = 0.9415), while the rate of inoculation has far less fit with its linear trend line (R2 = 0.392).
For the purposes of this analysis, the birth data from the 19 European countries listed in Table 1 will be examined in groups:


D1. Europe Group 1:
Table 2 gives the Spearman Rank Order Correlation Coefficient and p-values indicating strong correlation between the rate of injection of LNP/mRNA and acceleration in the decline of births nine months later.
Table 2 Group 1: Very strong correlation and Very Significant p-value < or << 0.005
| Country | Rho | p-value |
| Finland | -0.918 | 0.000033 |
| Switzerland | -0.873 | 0.00023 |
| Netherlands | -0.802 | 0.0015 |
| Latvia | -0.800 | 0.00156 |
| Austria | -0.773 | 0.00265 |
| Germany | -0.770 | 0.00461 |
| Lithuania | -0.741 | 0.0029 |
Switzerland will be used as an example of Group 1, because two independent statistical analyses of the birth rates and rates of LNP/mRNA injection were performed by Hagemann, et al. and Beck and Vernazza. The Swiss data will be reviewed in detail.
Example: Switzerland
Hagemann, et al. Analysis
- 7% Decline in Births through May 2022.
- Inoculation Rate = 64.2%.
- Very Strong Negative Correlation Between Rate of LNP/mRNA Vaccination and Decline in Birth Rate Spearman rho = -0.873.
- Highly Statistically Significant p-value = 0.00023.
Chart 12: Monthly Birth Rates
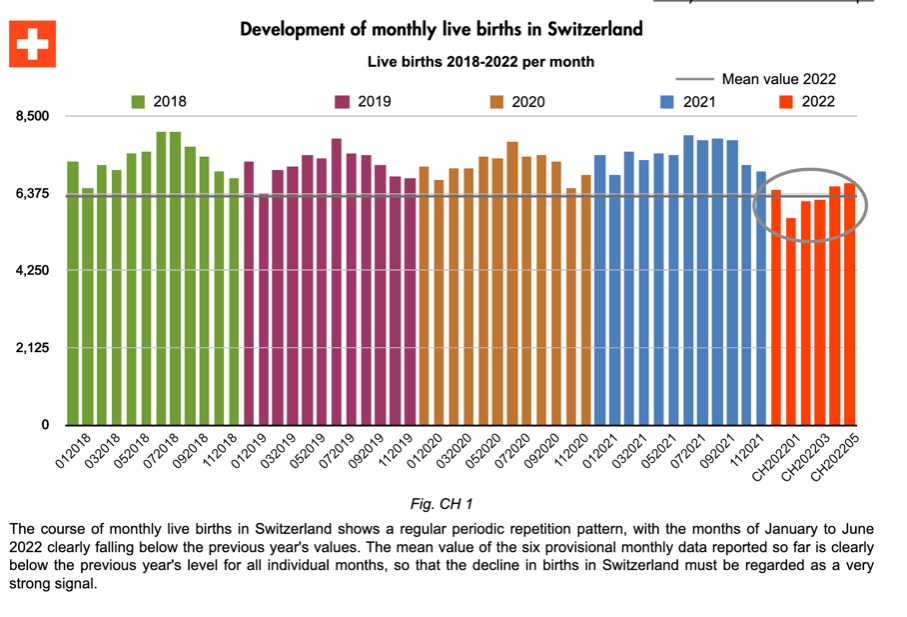
There is a visible drop-off in births in 2022 compared with the previous four years, consistent with an acceleration in the rate of birth decline.
Chart 13: Swiss Birth Decline Temporally Related to LNP/mRNA Not COVID-19
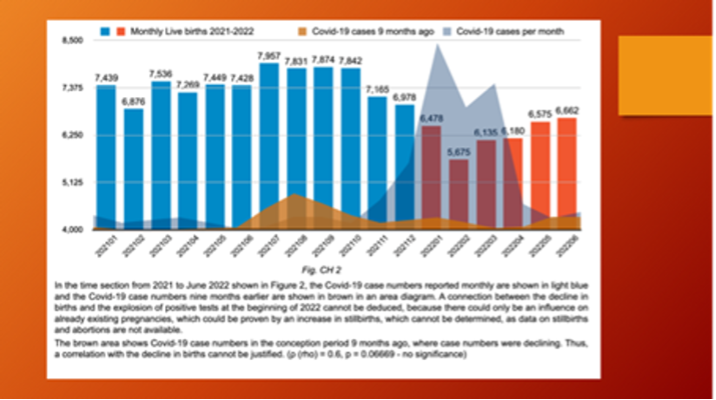
COVID-19 peaked in August 2021, as represented by the brown curve, but the birth rate decline began in November of the same year. Hagemann et al. concluded that peak COVID-19 has little to no association with the decline in births.
Chart 14: Monthly Change in Births 2019-2022
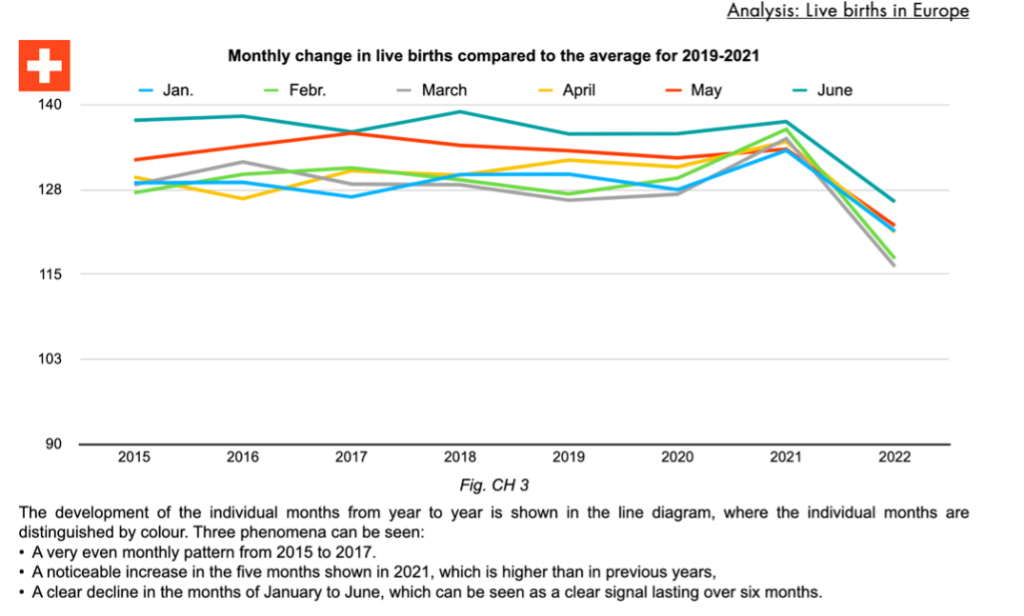
The sharp drop-off in monthly births for the first six months of 2022 compared with the prior four years is striking.
Table 3: Monthly Average Births Per Million Women Ages 20 to 49
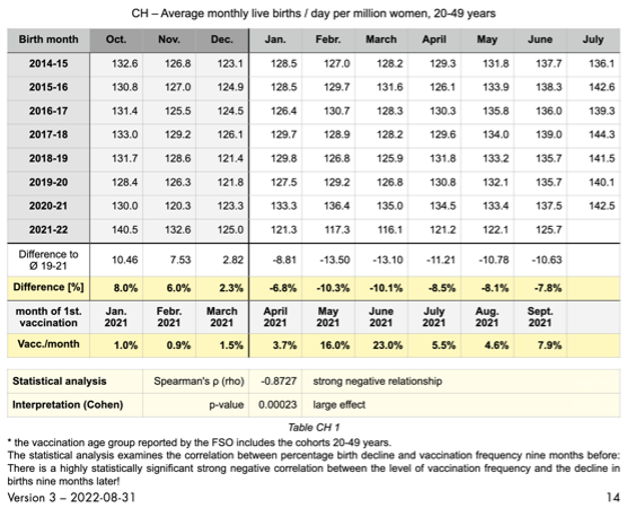
Table 3 above contains the average monthly live births/day per million ages 20 to 49. Comparing 2022 to the prior seven years, a precipitous decline in births began in January 2022.
Chart 15: Nine-Month Lag from Injection to Accelerating Decline in Births.
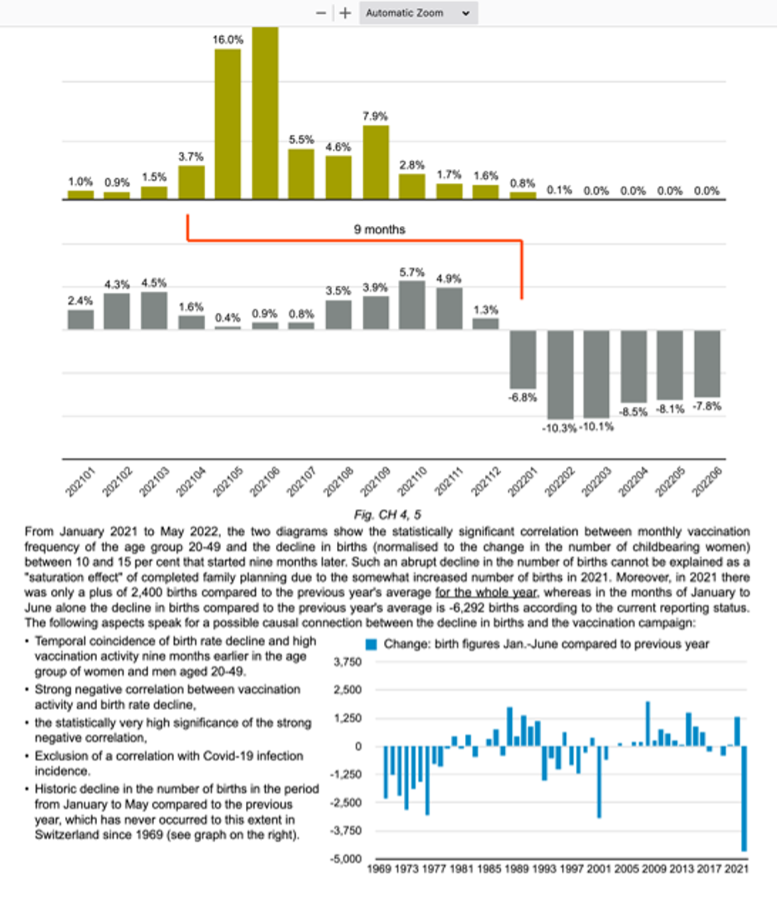
Chart 15 above illustrates the nine-month time lag between the LNP/mRNA gene therapy with LNP/mRNA and the acceleration in the decline of births in Switzerland.
Chart 16: Visual Display of January-June Birth Data from 2012-2022
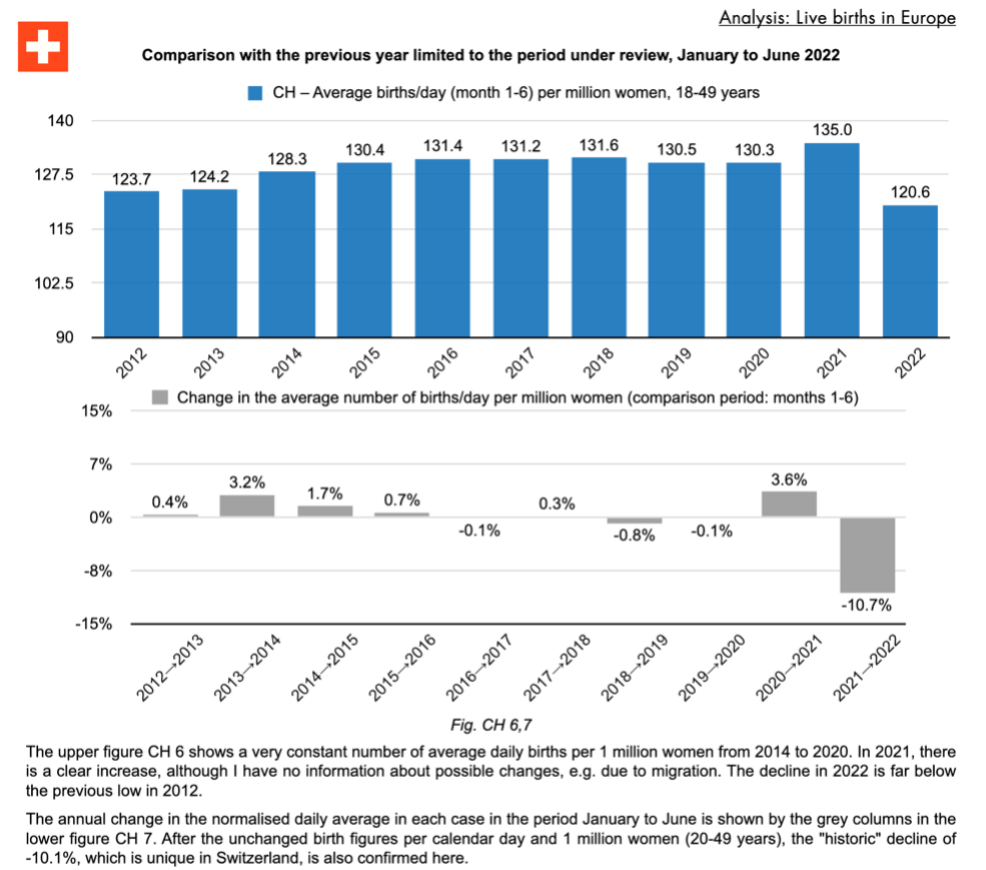
A drop of 10.7% occurred during the first six months of 2022, compared with much smaller changes in the years from 2012 through 2021, and was another indication of substantial acceleration in the decline of birth rate in 2022.
Chart 17: Swiss Birth Decline Monthly Comparison 2019-2022
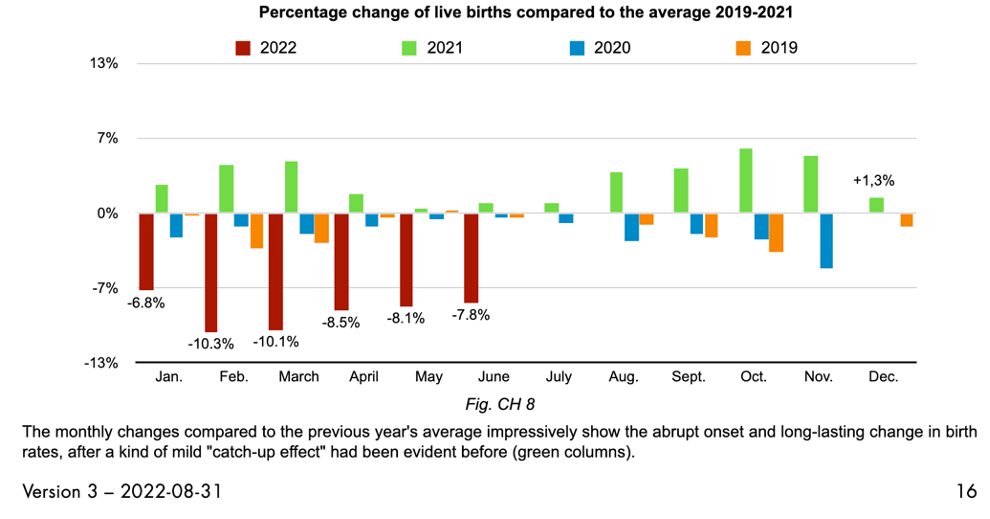
Chart 17 above presents monthly birth data from four years to illustrate the large drop in birth rates in 2022 compared with those in 2019, 2020, and 2021.
Hagemann et al. examined all 26 Swiss states, known as Cantons, using this methodology and found:
“In sixteen cantons, this decline is over 10%, in eight cantons over 15% and in three cantons close to or well over 20%.
A strong negative correlation between the decline in the birth rate and vaccination frequency can be seen in Switzerland as a whole in the cantons of Zurich, Bern, Lucerne, Schwyz, Solothurn, Basel-Stadt, Basel-Landschaft, Graubünden, Aargau, Ticino, Vaud, Geneva and Jura. The nine months vaccination frequencies and the current decline in births are with high probability not statistically independent due to the strong negative correlations, combined with low p-values, which indicate a significance or high significance. These are the largest cantons with 6.3 million inhabitants, which together make up 72.7% of the Swiss population.”
Beck and Vernazza Analysis of Swiss Birth Data
Professor Konstantin Beck, economist at the University of Lucerne, and Professor Emeritus Dr. Pietro Vernazza, infectious disease specialist at the Kantonsspital St. Gallen, published a second look analysis of the Swiss data using a statistical tool called a Difference in Difference Analysis for Swissmedic, the Swiss authority responsible for the authorization and supervision of therapeutic products, on September 22, 2022.
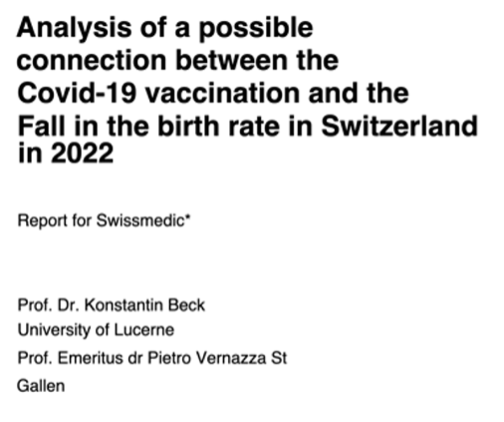
An extensive analysis of the LNP/mRNA inoculation rates and birth rates in the 26 Swiss Cantons is described in their 39-page report.
They concluded:
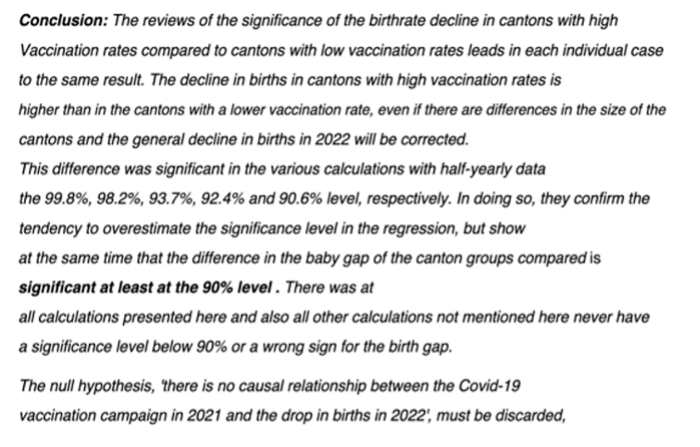
Beck and Vernazza prepared a graphic which presents a striking graphical illustration of what happened to the birth rate in Switzerland after institution of the LNP/mRNA injection program.
Chart 18: 150 Years of Birth History in Switzerland
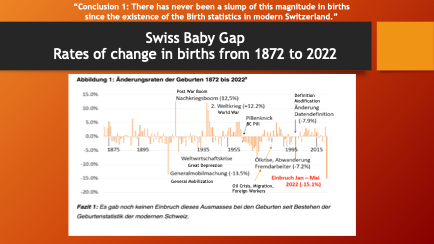
Chart 18 shows the drop in births year-to-date in May 2022 after LNP/mRNA injection program initiated in 2021 in comparison with other significant events such as World War I, the Great Depression, World War II, and the advent of the birth control pill. Beginning approximately nine months following the rollout of the LNP/mRNA program in Switzerland there was the largest drop in birth rates in Switzerland in the last 150 years.
The Swiss Federal Council is Alerted but Rejects the Appeal to Investigate
On September 9, 2022, a letter was sent to the Federal Council, the executive body of the Swiss Government in Bern, the capital of the Swiss Confederation, signed by Kullmann, Martin, Speiser-Niess, Rashidi, and Krähenühl who were alarmed by the large drop in birth rates identified in the Beck Vernazza report. [https://docslib.org/doc/2062860/intervention-parlementaire-n-parlementaire]
The Council responded by noting that there was a recovery in the birth rates beginning in May and June of 2022, final figures were required, there had been past declines in births, the drop followed a rise in 2021, and countries like France had a very high vaccination rate but no substantial drop in births.
In defense of their position, they pointed out the findings in the Shimabukuro, et al. report of the CDC and FDA and two other sources. See https://robertchandler.substack.com/p/cdcfda-safety-evaluation-in-pregnant https://robertchandler.substack.com/p/misinformation-cdcfda-style-retroactive or https://dailyclout.io/report-40-2021-cdc-and-fda-misinformation-retroactive-editing-erroneous-spontaneous-abortion-rate-calculation-obfuscation-in-the-new-england-journal-of-medicine/ for a discussion of the highly flawed and misleading report from the CDC and FDA.
Not everyone was satisfied with this response:
Figure 3: Article in Swiss Magazine
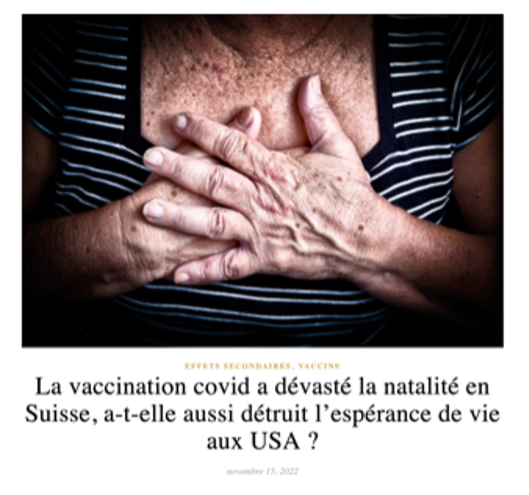
The above article in “The Truth Will Set You Free” published November 15, 2022, asks “Covid vaccination has devastated the birth rate in Switzerland, has it destroyed life expectancy in the USA?”
Clearly, this matter is not settled in Switzerland as there is a case pending in the Swiss courts that includes criminal charges against Swissmedic and individual doctors at the Inselspital University Hospital in Bern including allegations of wrongful death among other allegations. [https://coronacomplaint.ch/criminal-complaint/ and https://www.youtube.com/watch?v=fufq_KdyuVo]
Figure 4: Summary by Kruse Law Firm Zurich, Switzerland
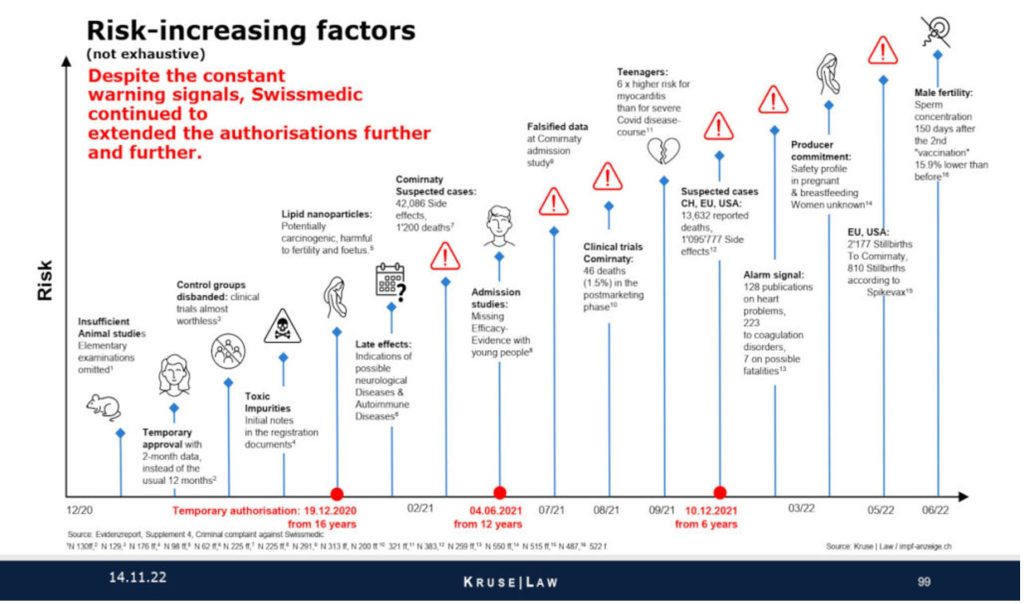
Mary Beth Pfeiffer published a worthwhile review of the Swiss/European decline in births related to the LNP/mRNA products:
https://rescue.substack.com/p/the-missing-babies-of-europe
The evidence report from the criminal case is available here:
https://audio.solari.com//covid-law-suits/EN_Evidence-Report_v1.0_DEEPL.pdf
Similar action may result from the investigation in Florida:
“Florida Governor Ron DeSantis said Tuesday he plans to ask the state Supreme Court to investigate ‘any and all wrongdoing’ connected to the COVID-19 vaccines, comparing the effort to recent rulings against manufacturers and distributors of opioids.” [https://www.yahoo.com/entertainment/desantis-compares-potential-covid-vaccine-233549015.html]
D2. Europe Group II: Strong Correlation, Significant p-value < 0.05
Table 4: Europe Group II
| Country | Rho | p-value |
| Hungary | -0.682 | 0.0104 |
| Poland | -0.673 | 0.0165 |
| Sweden | -0.664 | 0.0130 |
| Slovenia | -0.627 | 0.0194 |
| Estonia | -0.582 | 0.0302 |
| Romania | -0.527 | 0.0478 |
Example: Sweden
- -6.7% in Hagemann, et. Al. Decline in Births through June, (-8.3% through October 2022).
- Inoculation Rate = 76.7%.
- Moderate Correlation Spearman rho = -0.664.
- Statistically Significant p-value = 0.0130
Chart 19: Sweden: Monthly Live Births January-October 2019-2022.
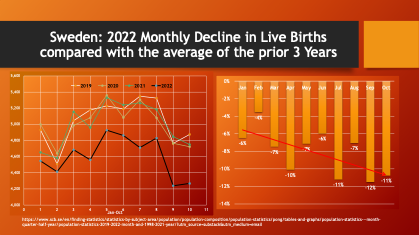
Monthly drops of 6% to 12% were recorded from January through October of 2022. There was poor fit with linear regression, y = -0.0057x – 0.0498 R² = 0.432, but there was suggestion of accelerating decline in live births as three of the largest drops in births were in the last four months.
Chart 20: Sweden Annual Births January to October 2019-2022
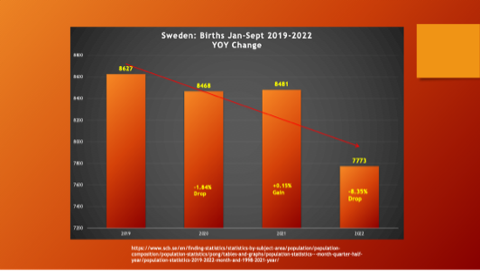
There was over 8% decline in births in 2022 compared with the three prior years through October 2022.
D3. Europe Group III: Weak Correlation, Insignificant p-value > 0.05 or >> 0.05.
Table 5: Europe Group III
| Country | Spearman’s rho | p-value |
| Czechia | -0.524 | 0.0914 |
| Denmark | -0.427 | 0.0949 |
| France | -0.355 | 0.1423 |
| Portugal | -0.297 | 0.2024 |
| Spain | -0.209 | 0.2686 |
| Belgium | -0.145 | 0.3348 |
Example: France (Group 3)
- -1.3% Decline in Births through May 2022.
- Inoculation Rate = 91.3%.
- Weak Correlation Spearman rho = -0.355.
- Not Statistically Significant p-value 0.1423.
Chart 21: Comparison of Monthly Births from 2019-2022 January Through October.
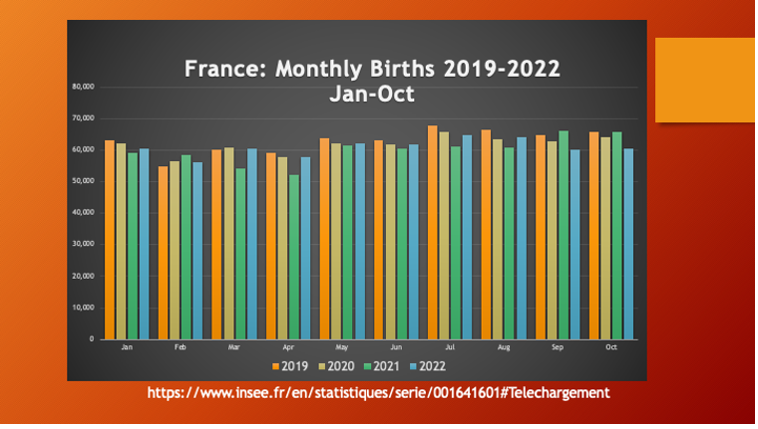
Chart 22: France: No Significant Association Between LNP/mRNA Injection Rate and Birth Rate Decline
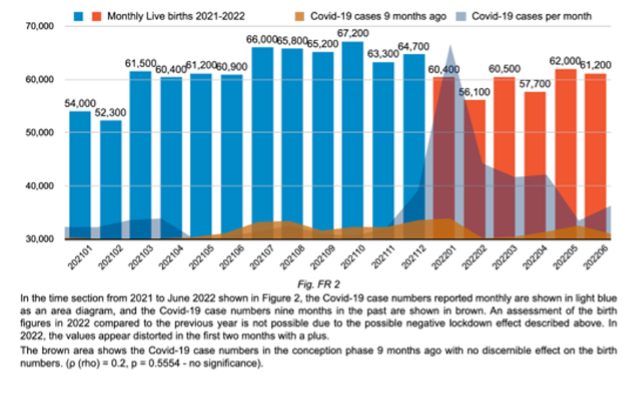
There is no pattern of acceleration in the decline in the live birth data from France. A high rate of inoculation, 91%, was not found to be followed by an acceleration in the declining rate of birth.
This fact brings into question the integrity of this data from France as there is a very strong signal indicating an acceleration in the rate of decline in live births in 13 of the 19 countries (68%) following injection of LNP/mRNA products. France is an outlier.
E. Further Analysis
Hungary (Group II)
- 7% Decline in Births.
- Strong Correlation, Spearman’s rho = -0.6818
- Statistically Significant p-value = 0.0104
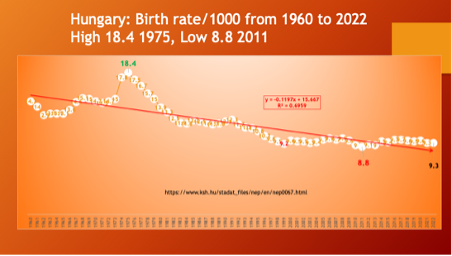
The long-term fertility pattern in Hungary is similar to many other countries, gradually declining live births. See Chart 22 below. Once again, the key is to look for acceleration in the rate of declining live births, not just the velocity. In this instance, there is what looks like a paradox with a small rate of decline but with a strong correlation and a strong level of statistical significance.
Chart 23: Hungary Long Term Birth Rate/1000
Attempting to explain these findings, Igor Chudov published an article on his Substack website on July 3, 2022, after looking at the vaccination rate in Hungary and the change in birth rate. He matched the birth declines with vaccination rates for the different counties in Hungary and placed the data on a color-coded map, Chart 23 below. [https://igorchudov.substack.com/p/hungary-most-vaccinated-counties]
Chart 24: Birth Rate Drop and Vaccination Rates
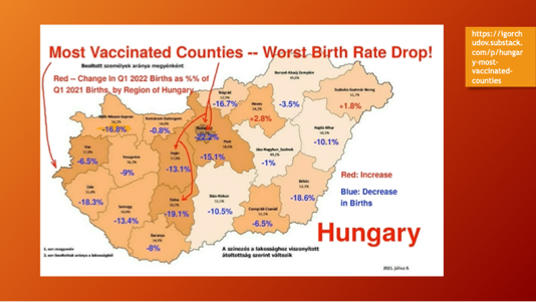
Chudov then observed:
“Unfortunately, this data is noisy, as it presents only a single-moment snapshot of vaccination rates, and they are not super dissimilar. To make the comparison less noisy, I decided to pick five MOST vaccinated counties, and five LEAST vaccinated counties.”
Chart 25: Comparison of Top Counties with High Vaccination Rates
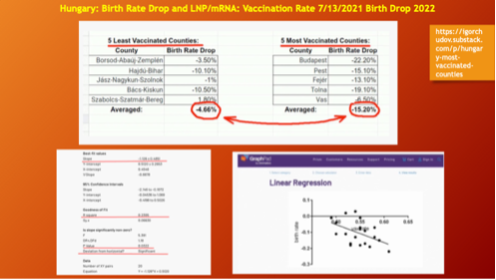
The birth rate drop was more than three times greater in the highest vaccinated counties compared with the five counties with the lowest vaccination rates. The trendline had negative slope supporting this statistic. The R2 indicated a negative correlation between the vaccination rate and the birth rate with a p-value of 0.0322, significant statistically.
Chudov’s conclusion:
“What is important is that statistical analysis shows the slope to be ‘statistically significantly different from zero’, in other words, the effect of vaccination on birth rate is highly likely NOT a fluke.”
The evidence is piling up to support the conclusion that fertility impairment results from injection of LNP/mRNA products in humans.
F. Shenanigans?
In the context of the 22 countries discussed above where there was substantial evidence of significant acceleration in the declining birth rates nine months following the rollout of the LNP/mRNA inoculation campaign is the curious case of Victoria, Australia.
Victoria is the second smallest state in Australia by land area, location of the second largest city, Melbourne, and has a population of 6.5 million according to Wikipedia. [https://en.wikipedia.org/wiki/Victoria_(Australia)#cite_note-ABSPop-1]
Chart 26: Registered Births in Victoria, Australia Monthly from September 2019 through November 2022
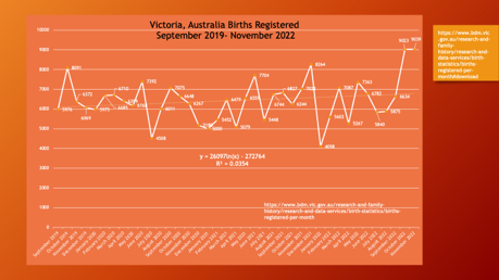
The birth rate oscillated between 5,267 and 7,363 until October when there was a gain of about 35%, a level that continued in November 2022. This trend goes against the long-term pattern of decline and is one of the only examples of a positive acceleration of birth rate seen to date.
Births tend to follow a circannual pattern with fewer winter births and more in the spring and summer.
We can all hope that our health care authorities are diligent and honest in their data collection and reporting. Such may not be the case.
VI: Discussion
Analysis of birth data from 22 countries using a variety of analytic methods has identified strong correlation between the rate of injection with LNP/mRNA products and a subsequent acceleration of the baseline rate of decline in birth rates in 68% of European countries studied beginning approximately nine months following institution of LNP/mRNA gene therapy. For all 19 countries representing 1,59,745,448 individuals ages 18 to 49, there was a 7% decline in birth rate with a correlation coefficient of -0.522 and p-value of 3.014E-14 or 0.00000000000003014. Similar findings were found in England/Wales, Australia, and Taiwan.
Patient-level data is sorely needed. In the absence of double-blind, randomized clinical trials of at least two years’ duration, prospective matched control studies, detailed and large-scale retrospective studies, detailed autopsy reports, and other forms of traditional medical research which has largely been banned by governments, researchers are left analyzing population data.
Population studies are complex in many respects although graphical presentation of data, as shown in the Swiss section, when backed up by two different statistical studies of population data by two different teams are providing the best information currently concerning birth rates.
The Hagemann, et al. study identified accelerated birth declines in 13 of 19 European countries (68%) in August 2022 and tied the decline to LNP/mRNA injections received nine months previously. They had previous found the same strong statistical correlation with low p-values in their August 12, 2022, study of the 26 Swiss Cantons. Beck and Vernazza questioned the methodology of these findings and used different statistical techniques that supported the findings of Hagemann, et al.
US, UK, and Australian data may not meet high standards. American data has yet to appear and may be suspect when it does, given the control exerted by the Department of Defense and the US intelligence agencies. The UK data has ceased to flow. [https://natyliesbaldwin.com/2022/11/debbie-lerman-governments-national-security-arm-took-charge-during-the-covid-response/, https://jdfor2020.com/2023/01/on-american-state-level-prosecution-for-federal-government-chemical-and-biological-wmd-crimes/, and https://sashalatypova.substack.com/p/the-role-of-the-us-dod-and-their]
Further studies like those of Hagemann, et al. and Beck et al. are needed. Organizations should be established to perform statistical analyses on macro data; however, it must be complemented with patient-level studies, supported by laboratory study of tissue samples from autopsy and surgically removed tissues, to strengthen the case for a causal link between LNP/mRNA gene products and impaired fertility.
The evidence is growing that both male and female reproductive functions and organs are adversely affected by LNP/mRNA products with lowered sperm motility and counts, menstrual irregularities, and reproduction organ dysfunction.
It now appears that this adverse impact on reproductive organs and functions has become manifest as an acceleration in the decline of birth rates in the UK, Oceania, Asia, and 13 of 19 countries in Europe. There is strong support of a causal link between LNP/mRNA injections and acceleration of declining births nine months later. [https://sashalatypova.substack.com/p/my-affidavit-on-modernas-nonclinical, https://rescue.substack.com/p/deep-in-the-wombs-of-women-the-hidden, https://www.preprints.org/manuscript/202209.0430/v2, https://lostintranslations.substack.com/p/menstrual-changes-and-very-early, and https://behindthefdacurtain.substack.com/p/pfizer-fda-cdc-hid-proven-harms-to?amp]
VII. Conclusion
The pattern that began years to decades ago of declining birth rates in the developed world appears to be accelerating after the introduction of LNP/mRNA gene products suggesting at least a temporary reduction in fertility as a result of interference with reproductive function in both men and women.
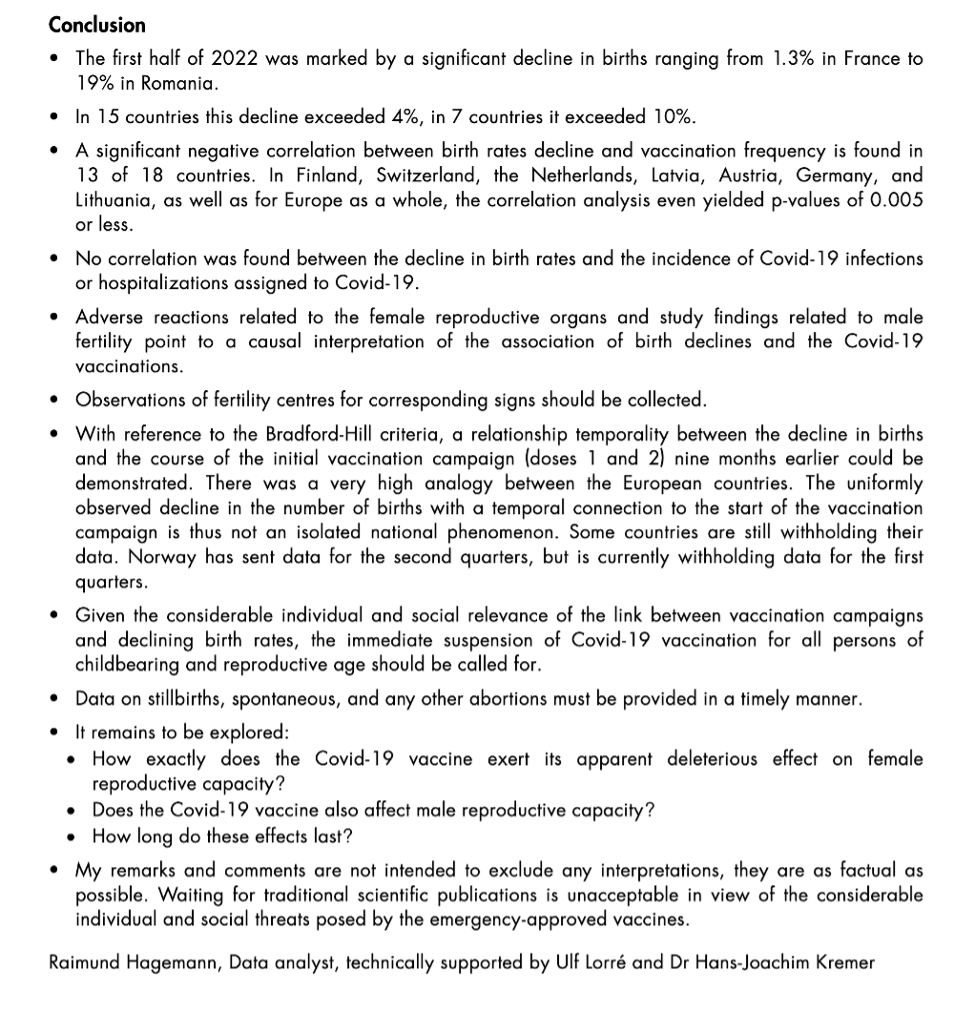
Appendix 1 contains the full list of conclusions from Hagemann, Lorré, and Kremer; and Appendix 2 contains those from Beck and Vernazza.
Epilogue
How long will it take people around the world to blame the USA for vaccine harms as this “street art” from the Bahnhoff Strasse in Zurich in October 2022 indicates.
Figure 5: Sidewalk in Zurich, Switzerland
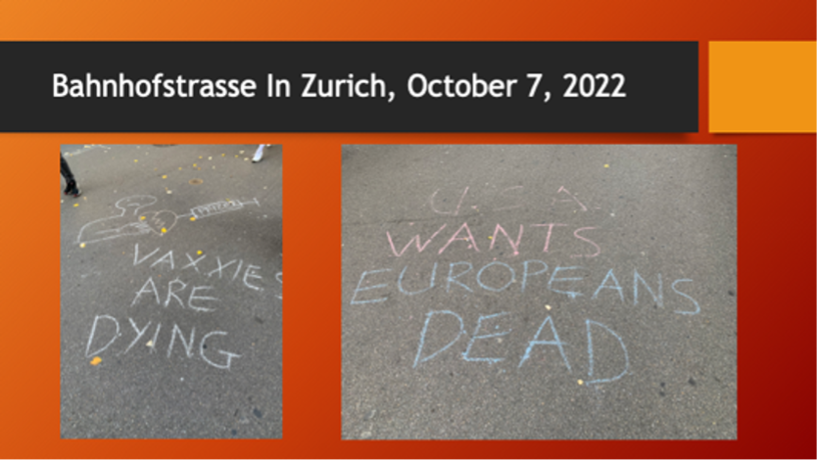
Will Americans face the scorn of the world community like innocent Germans did after World War II? Or will citizens of other countries blame their own health agencies and political leaders?
Appendix 1: Conclusion from Hagemann, Lorré and Kremer
Appendix 2: Conclusion from Beck and Vernazza
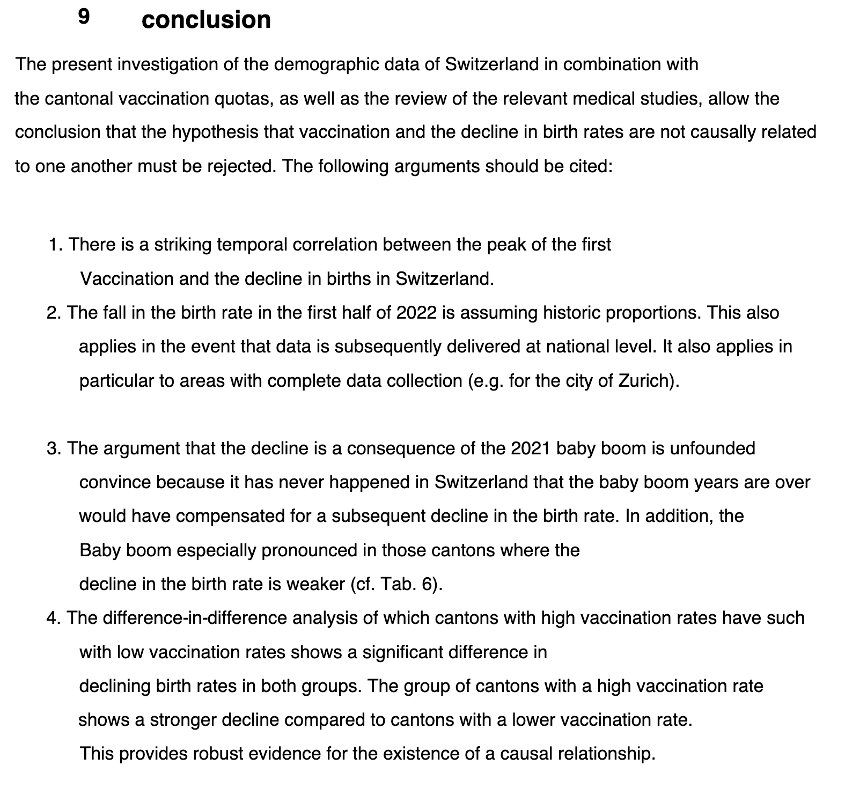
(PDF of report available for download.)
One of our country’s most important freedoms is that of free speech.
Agree with this essay? Disagree? Join the debate by writing to DailyClout HERE.


Hi, that’s a complex subject though super interesting. Is the document “Analysis of a possible connection between the
Covid-19 vaccination and the Fall in the birth rate in Switzerland in 2022” from Beck and Vernazza publicly available? I didn’t find it.
The primary source documents are posted on robertchandler.substack.com on same or similar title as this document as downloadable pdf.