Pfizer/BioNTech Trial – A failed yet in depth attempt to reproduce the NEJM & FDA efficacy figures
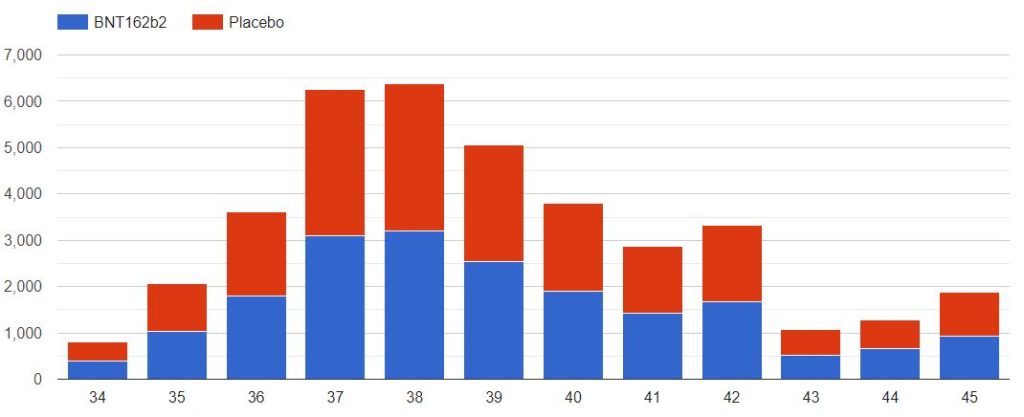
Study version 1.3, published on 2022-12-09
To view the full version with graphics, please click here.
Introduction
We review, in this article, a list of problems in the Pfizer/BioNTech C4591001 Trial, which came out in our attempts to reproduce the results provided by the study.
Using the sponsor’s data communicated to the FDA, and made available via the Public Health and Medical Professionals for Transparency’s Freedom Of Information request & lawsuits, we are able to demonstrate that multiple abnormalities are affecting the populations featured in the trial – to a proportion which may have affected the end result, primarily judged on a 170 patients efficacy sub-set.
In that course, most interesting articles were brought to our attention, by the DailyClout’s team 3, Jeyanthi Kunadhasan, MD (Gettr), Ed Clark, MSE, and Chris Flowers, MD (Gettr), and by anonymous whistle-blower Arkmedic (Telegram | Gab | Substack), highlighting multiple abnormalities in the trial.
Benefiting from their precious insights, and desiring to verify and to be able to support their figures, we dived in with Geoff Pain, PHD (Gettr), and are sharing here our preliminary findings, which, we hope, will simplify the accessibility of the data for other researchers who may want to study this critically important clinical trial.
People desiring to study the trial may also benefit from the reading of this report of interest by biostatistician Christine Cotton, “Evaluation of the methodological practices implemented in the Pfizer/BioNtech” trials in the development of its COVID-19 RNA-messenger vaccine in relation to Good Clinical Practices”, whose summary you can find here.
Preliminary facts reminder
The Pfizer/BioNTech vaccine “efficacy of 95%” was announced, through the press, on November 18, 2020, as per example this New-York Times Article, New Pfizer Results: Coronavirus Vaccine Is Safe and 95% Effective.
On November 20, 2020, as exposed on the Emergency Use Authorization (EUA) for an Unapproved Product Review Memorandum, the submission process for the EUA began. This process took some time and ended on December 10, 2020.
On December 11, 2020, a day later, the EUA was granted by the FDA.
Some of the key dates are summarized in the Timeline below.

In the paper Safety and Efficacy of the BNT162b2 mRNA Covid-19 Vaccine, published on December 31, 2020 in the New England Journal of Medicine (NEJM.org), by Fernando P. Polack et al., the World saw for the first time some details on the numbers backing this claim.
As established by the document pd-production-060122/125742_S1_M5_5351_c4591001-interim-mth6-publications.pdf, page 31 & following, the study was finalized on December 16, 2020. This document also includes the previous studies published.
PHMPT’s FOI & lawsuits allowed the public to access the documents which were supposed to stay hidden for 75 years, and which are supporting the FDA EUA & the NEJM study.
This data is therefore partially available, even if key files required to reproduce the original code, such as the ADSL file (Subject-Level Analysis Data), are still not provided when this study is written, on December 8, 2022.
This lack of transparency hasn’t evolved despite this recent letter from Peter Doshi to the BMJ on October 07, 2022.
The Data Cut-off dates featured in the NEJM study are unclear, and therefore clarified hereafter.
-
- Efficacy subset data cut-off was November 14 – but given 7 days were required post dose 2, no patient injected post November 7 was included
- Safety subset data cut-off was October 9 (at least 2 months of follow-up post dose 1)
The stated Interval between injections of 21 days, in the NEJM study, is misleading. As illustrated in the NEJM protocol, page 347 & the table 2 of the FDA Memorandum, page 18, the delay is in reality an interval of 19 to 42 days. This point was brought to our attention by The DailyClout’s team 3’s Report 42: Pfizer’s EUA Granted Based on Fewer Than 0.4% of Clinical Trial Participants. FDA Ignored Disqualifying Protocol Deviations to Grant EUA.
This article also highlights several abnormalities which we encourage researchers to review.
We mapped these cases, which only highlighted the importance of site 1231, led by the NEJM study’s lead author, Fernando Polack. We verified the listing of the subjects sustained for the efficacy case located by the DailyClout team 3, and desired to calculate the infection rate by site.
It must also be emphasized, as mentioned page 24 of this document that “virtual sites” were created and integrated in the patient “unique id”. It is of importance as site 4444, virtual site of site 1231, often appears in the efficacy results.
Last, as it had been already highlighted by Arkmedic (in one of his many former (censored) Twitter incarnations, Jikkyleaks, archived on Telegram here), every swab analysis was made in the Pfizer’s Pearl River laboratory in New York – even if local analysis had been performed by the trial site lab.

This central lab prevalence is highlighted in the Protocol from March 2, 2021, while this precision doesn’t figure in the November 27, 2020 version of the protocol.
When a conflict was arising between the central laboratory results & the local laboratory result, the sole results sustained were the central laboratory results.
Methodology
Data has been automatically downloaded from the PHMPT’s website, extracted & converted to processible files. The code has been written using Perl 5, and the dependencies required are documented on this page.
The scripts & data are freely accessible, and detailed further in the Methodology Details section. Additional libraries (open source & freely accessible) have been documented when required.
Results
We have used, to date, several type of useful sources in our attempts to reproduce the NEJM study calculations:
- 260 PDF Documents, detailed in the following .XLSX file
- 80 XPT Files, detailed in the following .XLSX file
- 27 XLSX Files, dumps from SAS files
This paper focused on reproducing the figures communicated to the NEJM by Pfizer & BioNTech as far as the efficacy subset was concerned. It led us to highlight that the figures featured in the NEJM study & in the FDA memorandum are vague, and sometimes contradicting each other (1).
Most of the population figures featured in the study are in no way reproducible given the current state of the data and are highlighting multiple anomalies (2).
It is also unclear why some patients haven’t been included in the efficacy data while they appear to have tested positive prior the data cut-off – particularly in the NEJM article (4).
Lastly, a sequence of 8 subjects testing positive out of the sole Argentinian site appears quite unlikely to have appeared by chance in the context of a fair, randomized trial (4).
We summarized the following discrepancies (in red) and similitudes (in green) between the FDA submission & the NEJM figures.

As highlighted, the randomization data doesn’t correspond between FDA & NEJM figures, with 103 more subjects in the FDA memorandum.
One of the rare points of accordance between these is that 43 448 subjects have been injected with a first dose. However, although that’s one of the subjects details we have at disposal, attempts to reproduce these calculations according to the trial criteria have been unsuccessful.
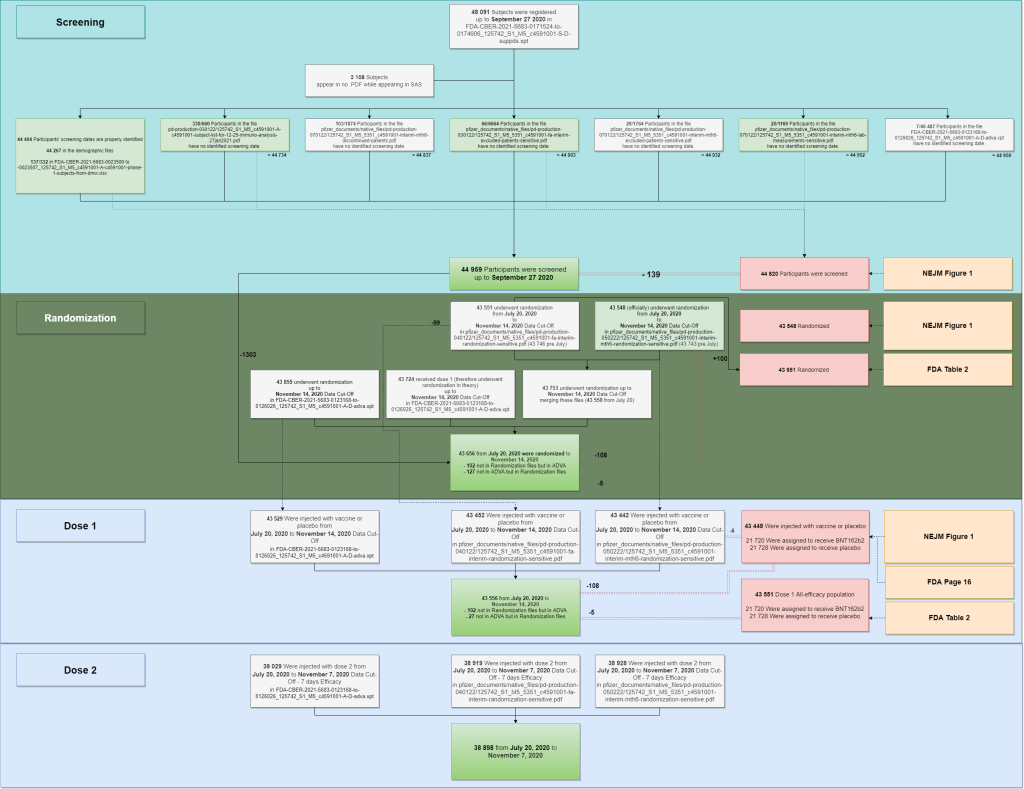
The multiple files used to reproduce the population figures are summarized in the following diagram.
-
- Two SAS files are keeping track of 48 091 subjects initiations.
-
-
- FDA-CBER-2021-5683-0169082-to-0171523_125742_S1_M5_c4591001-S-D-suppdm.xpt
-
-
-
- FDA-CBER-2021-5683-0171524-to-0174606_125742_S1_M5_c4591001-S-D-suppds.xpt
-
-
- 3108 of these subjects aren’t appearing in any PDF file. A list of “44 982 subjects likely to have been screened” was generated parsing the PDF & SAS files – but this figure may include some rare duplicate subjects. When no screening date was documented, we evaluated it based in the display order of the .XPT file, after verifying that it was indeed incremental for the 44 404 subjects for whom screening dates were known. The last subject (subject 44442322) also appears in the PDF demographic file as the last subject recruited by virtual site 4444 (site 1231) on September 27, 2020.
-
- We can speculate, based on this data, that the “44 820 subjects screened” quoted in NEJM Table’s 1 has been established only integrating the sources with a green background. Why subjects who are present in lab analysis for malignancies, cerebrovascular issues, leukemia, tumors or lymphomas would have been excluded from the “screening scope” is unclear.
-
- Randomization data has been extracted for the PDF files. When no randomization data was available (102 subjects appearing in the ADVA files), the randomization date has been set to the first vaccination date (as is the case for most subjects). It is unclear why we have a 5 subjects offset with the FDA Memorandum; and therefore a 108 subjects offset with the NEJM ones.
- The doses injected have been built using the randomization PDF files & the ADVA XPT file. It is unclear why 102 subjects of the ADVA files aren’t appearing in the Randomization files – along with why 27 subjects from the randomization files aren’t in the ADVA file.
The subjects corresponding, according to the criteria determined by the protocol, to the efficacy subset, are represented in the following mapping.

We couldn’t find an explanation for these 5 subjects (10461292, 11471037, 11471145, 12231001, 12321087) standing out as having received two doses but having no ADVA data. 10361096 was incarcerated, but still should have performed visits to receive two doses.
As a side note, while we find 43 655 subjects randomized, 43 661 patients were claimed to have been recruited by Pfizer & BioNTech in this article from the New York Times, 2 Companies Say Their Vaccines Are 95% Effective. What Does That Mean?. Another number which appears nowhere in the FDA & NEJM studies, the closest being 43 651 in the FDA figures (cf. consort diagram [1] above).
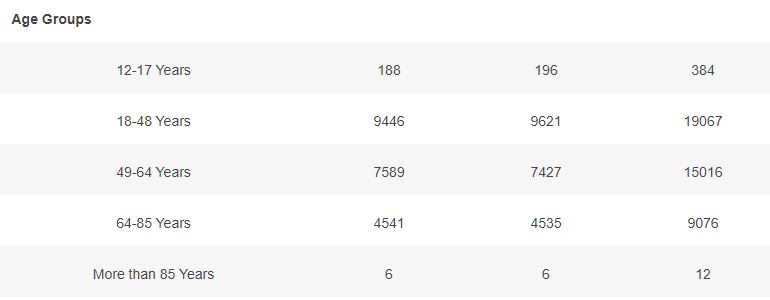
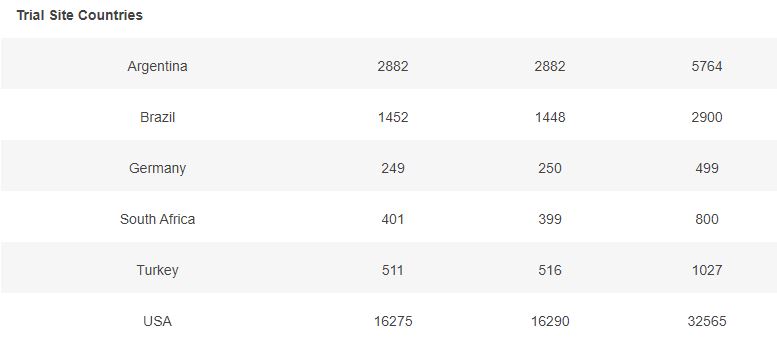
Basic demographic characteristics of the subjects who received a first dose of either BNT162b2 or Placebo are represented in the following table.

3.2 – Doses 1 Administered, Week by week
The first doses administered to 43555 subjects, 21785 in the placebo group & 21770 in the BNT162b2 group, week by week, from 2020-07-27 to 2020-11-14 (110 days), are represented in the chart below.
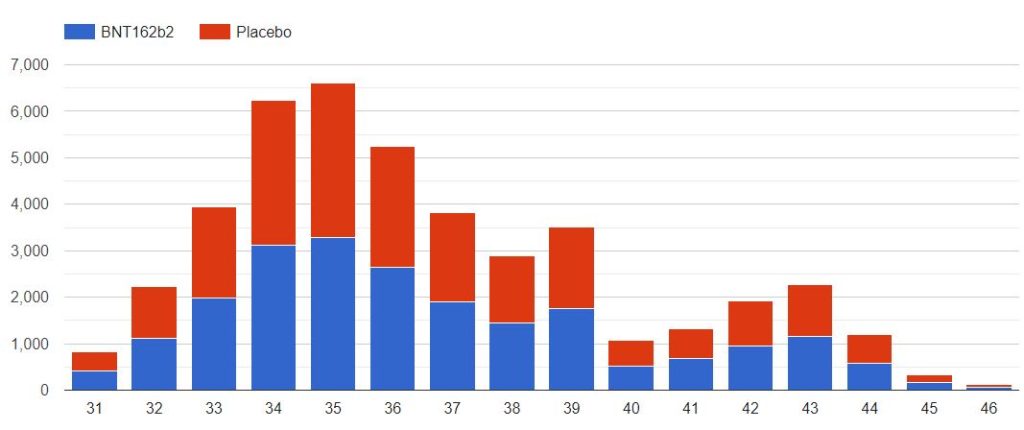
As you can verify for yourself using the above filter, it is unclear how site 1231, who enrolled so many more subjects than the other sites, was able to achieve completion of its schedule in just 52 days (most of the doses being injected within a 3 weeks window), while the other sites completed their doses schedule within multiple weeks in the overall 110 days period (excluding site 1231, within an average period of 64 days).

3.3 – Doses 1 Administered, Mapping by sites
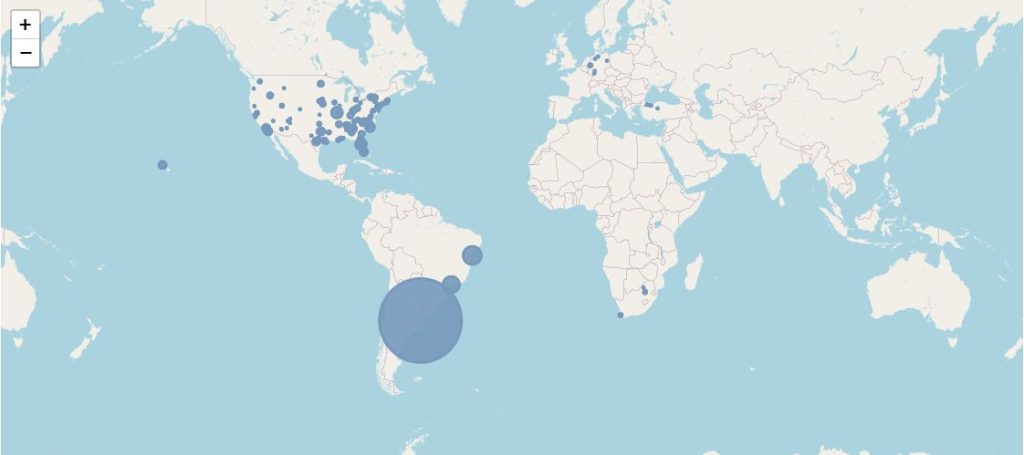
The following map illustrates the total of subjects injected with dose 1, by site. You can display only one specific site using the filter.
Note that the positions of the sites 1126 & 1270 are perhaps reversed, as both sites are listed on both identifiers, on the pd-production-111721/5.2-listing-of-clinical-sites-and-cvs-pages-1-41.pdf site listing.
3.4 – Subjects up to November 7, dose 2 within 19 to 42 days post dose 1, without Covid 7 days post dose 2, Demographic characteristics
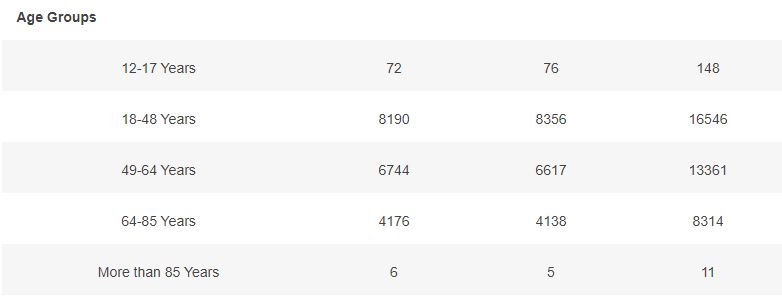
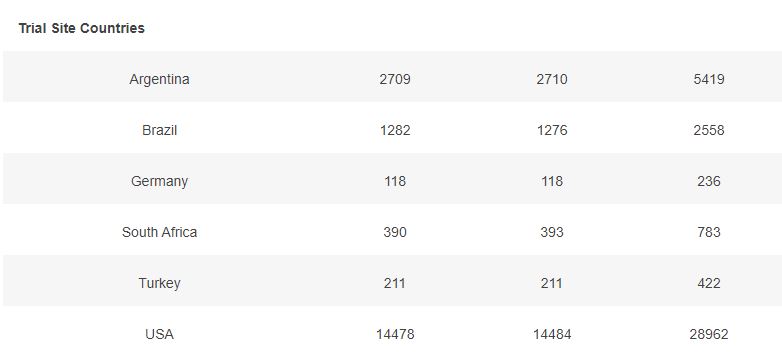
Basic demographic characteristics of the subjects who received a first dose of either BNT162b2 or Placebo are represented in the following table.

3.5 – Subjects up to November 7, dose 2 within 19 to 42 days post dose 1, without Covid 7 days post dose 2, Week by week
The second doses administered to 38380 subjects, 19192 in the placebo group & 19188 in the BNT162b2 group, week by week, from 2020-08-17 to 2020-11-07 (82 days), are represented in the chart below.

3.6 – Subjects up to November 7, dose 2 within 19 to 42 days post dose 1, without Covid 7 days post dose 2, and efficacy cases, Mapping by sites
The following map illustrates the total of subjects injected with dose 2 (in dark grey), by site, and the Covid-19 cases qualifying for the efficacy analysis (in red).
You can display only one specific site using the filter.
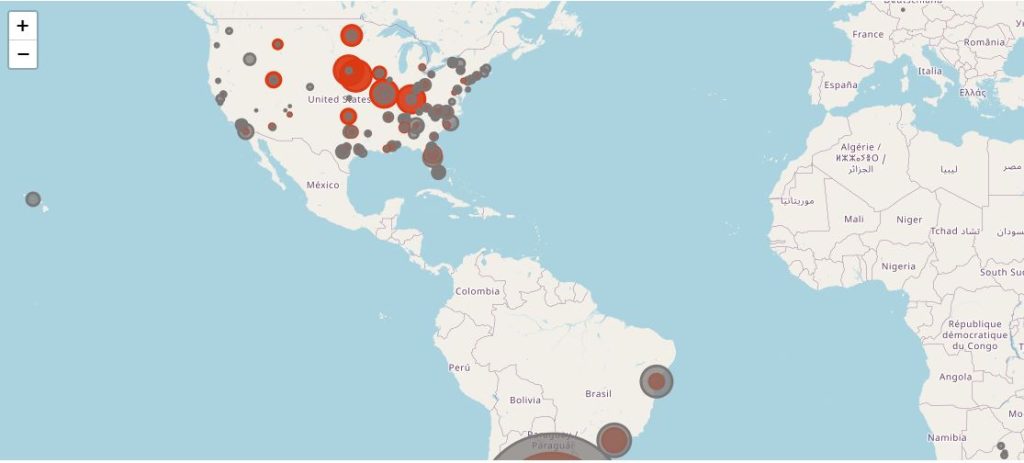
This map provides an even clearer highlight of the most abnormal incidence rate among patients in Nebraska, ranking 44th by population density in USA and 31th by urban population. A lot of these sites are belonging to the Meridian Clinical Research, LLC network, which, according to its website, operates 35 trial sites across USA. It is unclear whether only 6 Meridian sites were involved, or if other sites are also in the Meridian Network.
Further investigations of this very surprising geographical repartition, led by the Daily Clout investigators, are ongoing.
4 – Confirmed Covid-19 cases among eligible efficacy subset
This section focuses on the subjects who, according to the criteria exposed in the protocol (no HIV, not phase 1, at least 7 days post dose 2 prior Covid symptoms confirmed by a positive Polymerase chain reaction method (PCR)), would have qualified for the efficacy group.
4.1 – Incidence rate by trial site’s countries & population’s days of exposure
For each month, we evaluated the total of days of exposure (D.O.E) which occurred (total of subjects from their date of vaccination, or the beginning of the month if the subject was vaccinated before, to the end of the month).
We then divided this total of “days/subjects exposed” by the total of monthly days to reach a normalized incidence rate.

The IR in Argentina, in September (highlighted in yellow), with 8 cases, obviously poses question, while USA with much more subjects exposed only had 7 detected cases. Same applies in October.
John Hopkins University’s cases timeline for USA, and for Argentina are represented below, and the daily cases for September have been synthetized in this .XLSX file.


As we can observe in the .XLSX file, a total of 1 160 917 cases occurred in USA in November, for a population of (roughly) 331 501 080 citizen, according to the U.S Census Bureau flawed data, resulting in a September approximative IR of 3.5 / 1 000.
Argentina, on another hand, with 318 874 cases for a population of 45 376 763 citizen according to the World Bank, appears to have an approximative IR of 7 / 1 000 in September.
4.2 – Subjects with a confirmed Covid-19 swab
The 214 subjects confirmed for Covid-19 by a swab & a PCR, to data cut-off on November 14, 2020, and satisfying the conditions for eligibility, are detailed below. When they haven’t been included in the NEJM 170 subjects, they are highlighted in yellow.
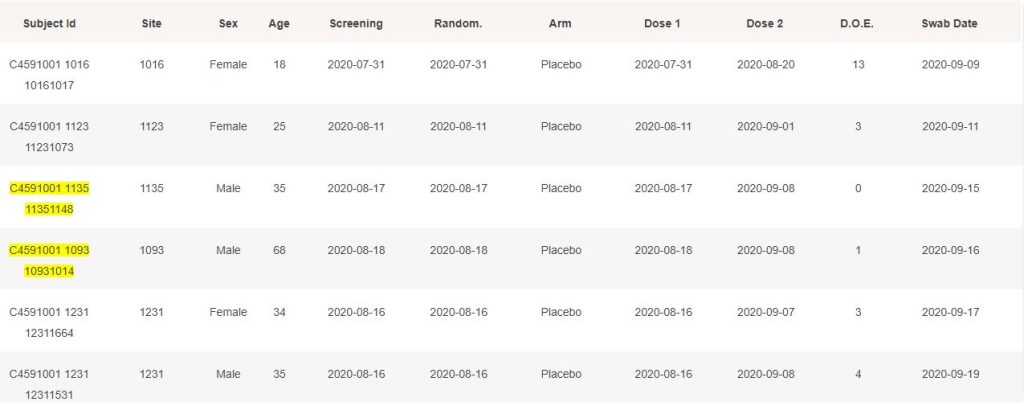
While it is understandable that cases post November 11 could rarely be processed in time to have them at disposal when results were announced through the press, it is not transparent why they weren’t included when the study was finalized, on December 16.
Furthermore, it is deeply unclear why subjects such as 10091005, 10111148, 10951098 or others weren’t included, as they have no preliminary exclusion documented.
We will study these deeper in a next article.
More concerning, it seems hardly understandable how site 1231 was able to provide 8 cases in a row, each of them being contaminated 2 to 8 days after being eligible for the efficacy subset.

To provide a raw approximate of the odds of 8 cases in a row appearing only in Argentina, while the other sites were silent, we ran a Monte Carlo simulation, based on an incidence rate of :
- 3.5 cases / 1000 subjects / month for USA
- 7 cases / 1000 subjects / month for Argentina
- 3 cases / 1000 subjects / month for the other less represented country
Simulations are summarized in the following table; resulting in a 0.2488% chance of this result occurring.

An imperfect evaluation, of course, as the high Argentinian Incidence rate is balanced by various unknown (couples among subjects, over-exposed healthcare workers, local variants).
We will refine the model used to take into account incidence rate by US state – data at city granularity being, unfortunately, very hard to find. How accurate is the fact of using John Hopkins’ data to evaluate trial sites infection trends also requires further examination.
4.3 – Cases up to November 7, dose 2 within 19 to 42 days post dose 1, without Covid 7 days post dose 2, Week by week
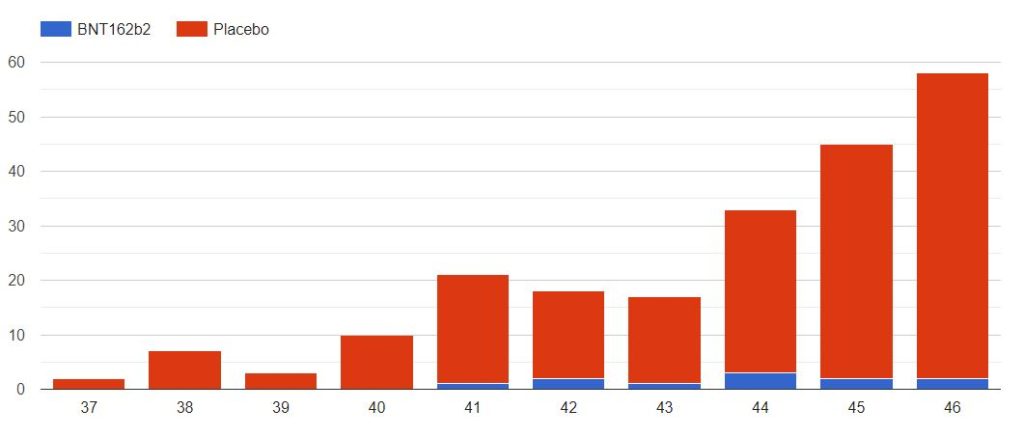
The cases observed on 214 subjects, 203 in the placebo group & 11 in the BNT162b2 group, week by week, from 2020-09-09 to 2020-11-14 (66 days), are represented in the chart below by swab dates.
5 – Methodology Details
5.1 – PHPMT Files Download & Extraction
You’ll need the XPDF version corresponding to your OS. Place the file (either pdftohtml on Linux or pdftohtml.exe on Windows) in your project repository.
You must answer “Y” when the script asks you if it should proceed with the extraction of the .PDF files, if you want to reproduce the global PDF statistics.
We automatically downloaded the documents from the Pfizer trials made available on PHMPT.org, using the script tasks/pfizer_documents/get_documents.pl (Github), and converted the .PDF files to .HTML using the same script.
5.2 – Global files analysis
The original data from the trial was generated from the Software “SAS”, and is delivered in several .XPT files.
XPT is a proprietary format constraining you to have SAS installed.
We extracted all the XPT files prefixed “FDA-CBER-2021-5683” (Documented on this PDF document, page 17 & following), using the Github project ReadStat.
We used the script tasks/pfizer_trials/subjects_in_sas_files.pl to analyze the XPT files (having converted these to .CSV first) and build an overview of the data available on each of the 48 091 subjects present in the 80 XPT files.
We used the script tasks/pfizer_trials/subjects_in_pdf_files_from_sas.pl to analyze the PDF files (having converted these to .html first) and build an overview of the data available on each of the 46 959 subjects present in the 260 PDF files.
5.3 – Key Files Extraction
Several files, have been sustained as key in the analysis.
5.3.1 – XPT Files
FDA-CBER-2021-5683-0123168+to+-0126026_125742_S1_M5_c4591001-A-D-adva.zip results in a .csv file (114 365 entry points, on 46 448 patients), which we converted to .JSON, using the tasks/pfizer_trials/extract_adva_data.pl script.
FDA-CBER-2021-5683-0171524-to-0174606_125742_S1_M5_c4591001-S-D-suppds.zip results in a .csv file (114 365 entry points, on 48 091 patients), which we converted to .JSON, using the tasks/pfizer_trials/extract_s_d_suppds.pl script.
All the .XPT files converted to .CSV can be downloaded here in .ZIP format (10.7 Go unzipped, 243 Mo zipped).
You must decompress this archive in your project root folder if you want to reproduce this analysis.
5.3.2 – PDF Files
Something one has to understand about the Pfizer trial documents released by PHMPT is that we have several editions of the same tables, which are completed by Pfizer & communicated to the FDA as the trial went along.
For example, there are several editions of the table “16.2.8.1”:
– One is labelled “16.2.8.1 Listing of Subjects With Postvaccination SARS-CoV-2 NAAT-Positive Nasal Swab and COVID-19 Signs and Symptoms – Dose 1 All-Available Efficacy Population”, which you can find in the file “pd-production-030122/125742_S1_M5_5351_c4591001-fa-interim-lab-measurements-sensitive.pdf”, finalized on November 24, 2020.
– One is labelled “16.2.8.1 Listing of Subjects With First COVID-19 Occurrence After Dose 1 – Blinded Placebo-Controlled Follow-up Period – Dose 1 All-Available Efficacy Population”, which you can find in the file “pd-production-070122/125742_S1_M5_5351_c4591001-interim-mth6-lab-measurements-sensitive.pdf”, finalized on April 1, 2021
The files extracted are summarized in the table below.


5.3.3 – Data Merging & Analysis
The following merge operations have been performed on the .JSON resulting from the SAS & .PDF files parsing.
-
- The tasks/pfizer_trials/compare_pdf_demographics.pl script merges the demographic data available in a single .JSON file.
-
- The tasks/pfizer_trials/eval_screening_from_sas_to_pdf.pl script generates approximate screening dates when none were available, and dispose of a single file for all subjects’ screening dates, generating another .JSON file.
-
- The tasks/pfizer_trials/analyse_adva_file.pl script merges the randomization dates available, and extrapolate approximate one when none were available, resulting in the following .JSON file.
-
- The tasks/pfizer_trials/eval_screening_from_sas_to_pdf.pl script merges the randomization dates available, and extrapolate approximate one when none were available, resulting in the following .JSON file.
-
- The tasks/pfizer_trials/compare_covid_cases.pl script merges the Covid cases resulting in the following .JSON file.
-
- The tasks/pfizer_trials/merge_doses.pl script merges the doses injections dates in the following .JSON file.
-
- The tasks/pfizer_trials/analyze_efficacy.pl script generates most of the end-usage statistics featured in this page, resulting, among other files, in this unified .CSV containing the merged subjects screened data.


