The Foreign Data Set Gutted This Week in VAERS, Cancer Signal Halved, and More
![](https://dailyclout.io/wp-content/uploads/1916cde9-7d7e-426f-826c-0b25b6e4fcc3_1699x892.webp)
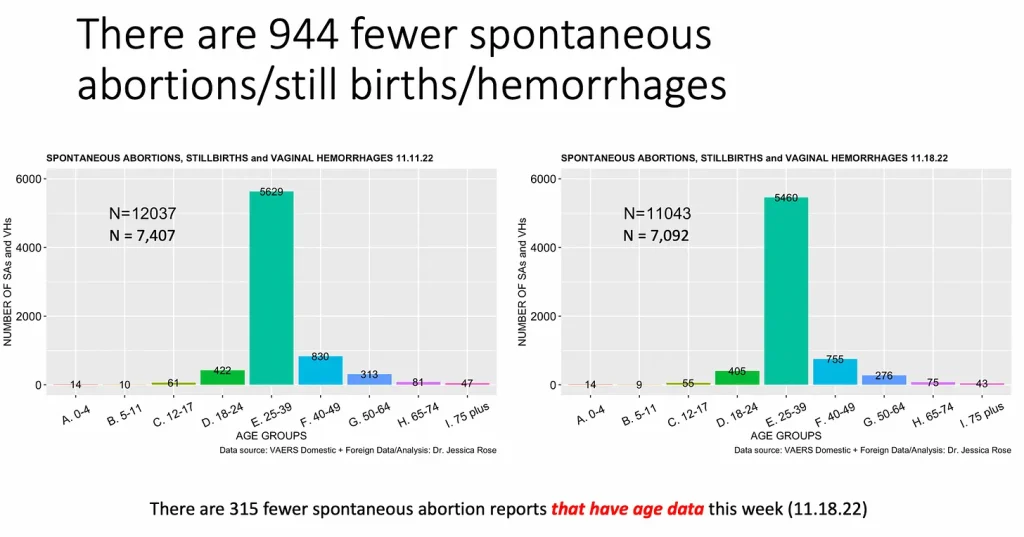
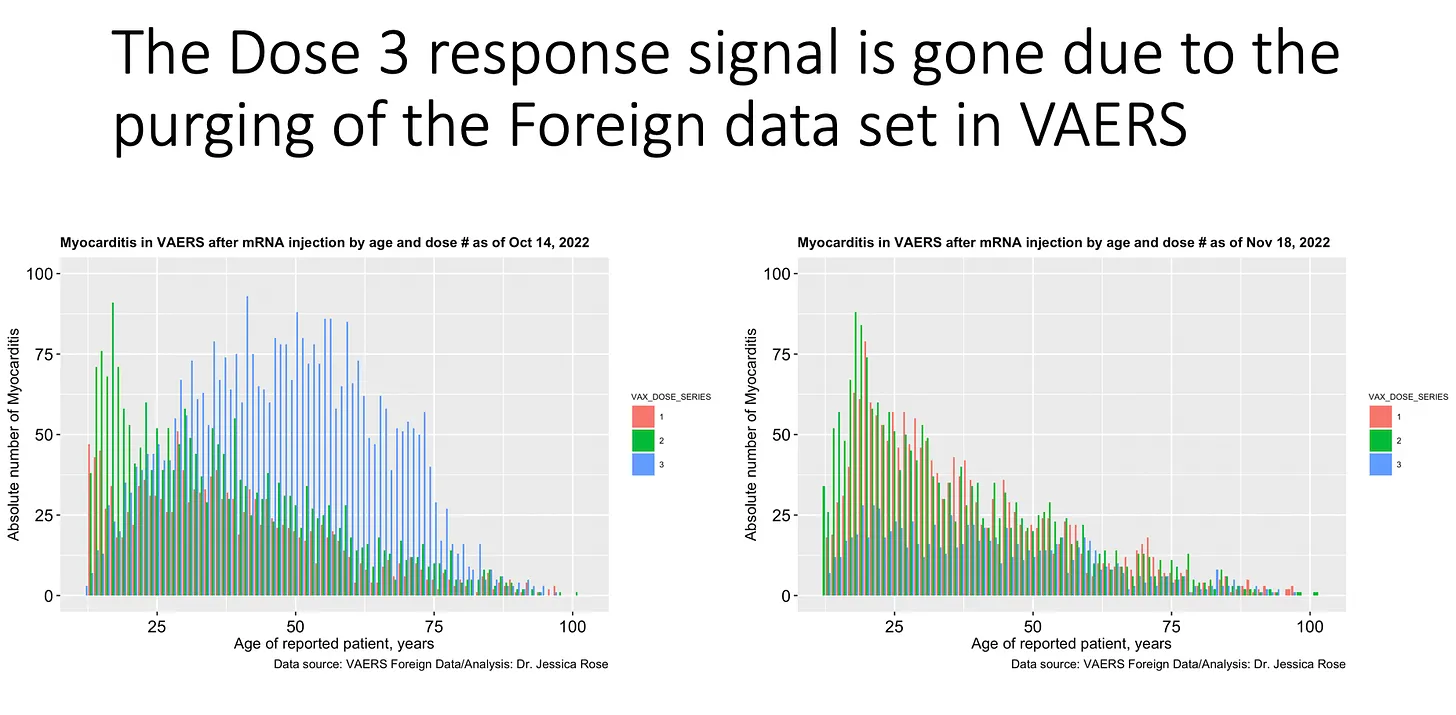
“The foreign data set was gutted this week in VAERS and the cancer signal was halved, the myocarditis dose 3 response signal was lost and 994 spontaneous abortions/still births were dropped”
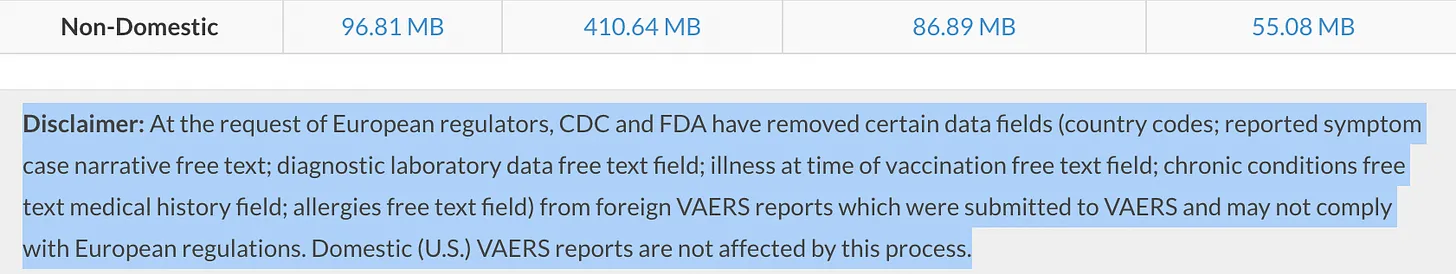
As most of you know, me and a bunch of other people are monitoring VAERS data very closely week-by-week. This week (11.18.22), the first thing I noticed was that the Foreign data set was less than a fraction of the size it was last week (11.11.22): down from 283.51 MB to 96.81 MB. There is a disclaimer under the VAERS data that states the following, so this is not mistake.
![](https://substackcdn.com/image/fetch/w_424,c_limit,f_auto,q_auto:good,fl_progressive:steep/https%3A%2F%2Fbucketeer-e05bbc84-baa3-437e-9518-adb32be77984.s3.amazonaws.com%2Fpublic%2Fimages%2Fd2cbd401-e433-4187-91b3-b376b7702738_1682x317.png 424w, https://substackcdn.com/image/fetch/w_848,c_limit,f_auto,q_auto:good,fl_progressive:steep/https%3A%2F%2Fbucketeer-e05bbc84-baa3-437e-9518-adb32be77984.s3.amazonaws.com%2Fpublic%2Fimages%2Fd2cbd401-e433-4187-91b3-b376b7702738_1682x317.png 848w, https://substackcdn.com/image/fetch/w_1272,c_limit,f_auto,q_auto:good,fl_progressive:steep/https%3A%2F%2Fbucketeer-e05bbc84-baa3-437e-9518-adb32be77984.s3.amazonaws.com%2Fpublic%2Fimages%2Fd2cbd401-e433-4187-91b3-b376b7702738_1682x317.png 1272w, https://substackcdn.com/image/fetch/w_1456,c_limit,f_auto,q_auto:good,fl_progressive:steep/https%3A%2F%2Fbucketeer-e05bbc84-baa3-437e-9518-adb32be77984.s3.amazonaws.com%2Fpublic%2Fimages%2Fd2cbd401-e433-4187-91b3-b376b7702738_1682x317.png 1456w)
I decided to process the data as I always do on Fridays.
The first thing I do when I analyze the VAERS data (after downloading) is compile the Domestic data set. Then I compile the Foreign data set. The I merge them along with the 2021 COVID-19 data. Then I count the numbers of VAERS IDs in both and do some basic descriptive statistics – like how many males versus females, age demographics, dose data and more. Then I start my grouped queries like death counts and severe adverse event counts, etc..
In the case of myocarditis, I always run the code over the Domestic, the Foreign and the combined data sets independently.
The first thing I noticed is that the myocarditis dose 3 response signal is gone. There is a 49% decrease in the number of myocarditis reports.
![](https://substackcdn.com/image/fetch/w_424,c_limit,f_auto,q_auto:good,fl_progressive:steep/https%3A%2F%2Fbucketeer-e05bbc84-baa3-437e-9518-adb32be77984.s3.amazonaws.com%2Fpublic%2Fimages%2F6ab09198-ba51-483b-bd62-74c277101bfb_1856x912.png 424w, https://substackcdn.com/image/fetch/w_848,c_limit,f_auto,q_auto:good,fl_progressive:steep/https%3A%2F%2Fbucketeer-e05bbc84-baa3-437e-9518-adb32be77984.s3.amazonaws.com%2Fpublic%2Fimages%2F6ab09198-ba51-483b-bd62-74c277101bfb_1856x912.png 848w, https://substackcdn.com/image/fetch/w_1272,c_limit,f_auto,q_auto:good,fl_progressive:steep/https%3A%2F%2Fbucketeer-e05bbc84-baa3-437e-9518-adb32be77984.s3.amazonaws.com%2Fpublic%2Fimages%2F6ab09198-ba51-483b-bd62-74c277101bfb_1856x912.png 1272w, https://substackcdn.com/image/fetch/w_1456,c_limit,f_auto,q_auto:good,fl_progressive:steep/https%3A%2F%2Fbucketeer-e05bbc84-baa3-437e-9518-adb32be77984.s3.amazonaws.com%2Fpublic%2Fimages%2F6ab09198-ba51-483b-bd62-74c277101bfb_1856x912.png 1456w)
The second thing I noticed was that 944 spontaneous abortions are missing.
![](https://substackcdn.com/image/fetch/w_424,c_limit,f_auto,q_auto:good,fl_progressive:steep/https%3A%2F%2Fbucketeer-e05bbc84-baa3-437e-9518-adb32be77984.s3.amazonaws.com%2Fpublic%2Fimages%2F1916cde9-7d7e-426f-826c-0b25b6e4fcc3_1699x892.png 424w, https://substackcdn.com/image/fetch/w_848,c_limit,f_auto,q_auto:good,fl_progressive:steep/https%3A%2F%2Fbucketeer-e05bbc84-baa3-437e-9518-adb32be77984.s3.amazonaws.com%2Fpublic%2Fimages%2F1916cde9-7d7e-426f-826c-0b25b6e4fcc3_1699x892.png 848w, https://substackcdn.com/image/fetch/w_1272,c_limit,f_auto,q_auto:good,fl_progressive:steep/https%3A%2F%2Fbucketeer-e05bbc84-baa3-437e-9518-adb32be77984.s3.amazonaws.com%2Fpublic%2Fimages%2F1916cde9-7d7e-426f-826c-0b25b6e4fcc3_1699x892.png 1272w, https://substackcdn.com/image/fetch/w_1456,c_limit,f_auto,q_auto:good,fl_progressive:steep/https%3A%2F%2Fbucketeer-e05bbc84-baa3-437e-9518-adb32be77984.s3.amazonaws.com%2Fpublic%2Fimages%2F1916cde9-7d7e-426f-826c-0b25b6e4fcc3_1699x892.png 1456w)
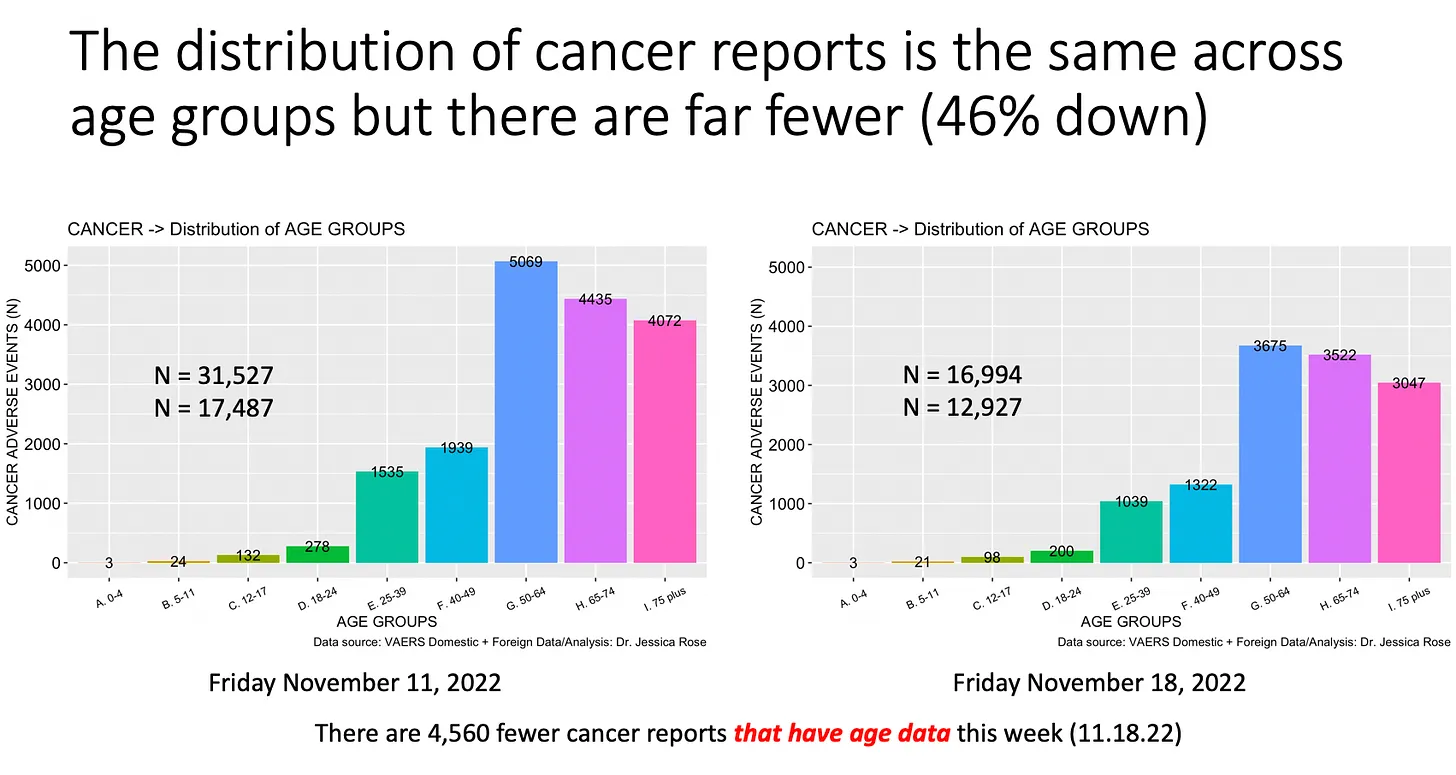
The third thing I noticed was that the cancer reports, although they maintain a similar age distribution as the previous weeks, as shown in Figure 4, there is a 46% decrease in reports.
![](https://substackcdn.com/image/fetch/w_424,c_limit,f_auto,q_auto:good,fl_progressive:steep/https%3A%2F%2Fbucketeer-e05bbc84-baa3-437e-9518-adb32be77984.s3.amazonaws.com%2Fpublic%2Fimages%2F6629e3c8-ece5-4f28-aac0-f1970917d364_1702x906.png 424w, https://substackcdn.com/image/fetch/w_848,c_limit,f_auto,q_auto:good,fl_progressive:steep/https%3A%2F%2Fbucketeer-e05bbc84-baa3-437e-9518-adb32be77984.s3.amazonaws.com%2Fpublic%2Fimages%2F6629e3c8-ece5-4f28-aac0-f1970917d364_1702x906.png 848w, https://substackcdn.com/image/fetch/w_1272,c_limit,f_auto,q_auto:good,fl_progressive:steep/https%3A%2F%2Fbucketeer-e05bbc84-baa3-437e-9518-adb32be77984.s3.amazonaws.com%2Fpublic%2Fimages%2F6629e3c8-ece5-4f28-aac0-f1970917d364_1702x906.png 1272w, https://substackcdn.com/image/fetch/w_1456,c_limit,f_auto,q_auto:good,fl_progressive:steep/https%3A%2F%2Fbucketeer-e05bbc84-baa3-437e-9518-adb32be77984.s3.amazonaws.com%2Fpublic%2Fimages%2F6629e3c8-ece5-4f28-aac0-f1970917d364_1702x906.png 1456w)
There’s so much more to cover, but I will update as time goes on.
See OpenVAERS for more.
This article was republished from the author’s Substack
Instructive would be a graph displaying the circumcised data superimposed over projected data based on the established historical trend line.