Report 46: How Many Pregnant Women Received LNP/mRNA via COVID-19 Vaccine During the Year 2021? Only Estimates Are Available.

Shockingly, as 2022 comes to a close and the world reaches the two-year mark of experimental COVID-19 vaccines being available to the general public, the scientific and medical communities, as well as everyday citizens, still have very little information about the effects of mRNA COVID-19 vaccines on pregnant women and their babies. Public health agencies seem unconcerned about the possible effects of lipid nanoparticles (LNP) and mRNA on recipients of the vaccines, including on pregnant women who were previously treated as a special class of patient to not be given most medications and, especially, not experimental ones. How many unborn babies have been lost to this worldwide scientific experiment? No one knows for sure given the lack of vigorous pharmacovigilance following the LNP/mRNA vaccine rollout. However, birth rates are plummeting in highly mRNA COVID vaccinated countries (https://igorchudov.substack.com/p/hungary-most-vaccinated-counties), and the responsible approach is to continue to seek answers to how what appears to be a genocide in progress is still being allowed to happen.
I: Searching for the Denominator
Prospective studies of pregnant women who received lipid nanoparticle plus messenger ribonucleic acid (LNP/mRNA) injections for prevention of COVID-19 during 2021 were scant, leading to difficulty in computing rates of spontaneous abortion, stillbirth, congenital anomaly, perinatal fatality, prematurity and small gestational size.
The Centers for Disease Control and Prevention (CDC) and the Food and Drug Administration (FDA) published the results of their surveillance of pregnant women in 2021. (https://www.nejm.org/doi/full/10.1056/NEJMoa2104983?query=recirc_curatedRelated_article)
Using the v-safe registry, Shimabukuro, et al. reported on 35,691 pregnant women who received at least one dose of LNP/mRNA during pregnancy. Of these, 3,958 were included in the Pregnancy Registry, and 127 were identified as having been inoculated during their first two trimesters and then completed their pregnancies.
These numbers were published in the New England Journal of Medicine (NEJM) in April, June, and October of 2021 with no additional entries or expansion of the data set other than a separate subject group reported by Zauche, et al. in August of 2021. The Zauche, et al. data set only had data through 20 weeks gestation, did not include the first six weeks of gestation, and was a small, non-representative sample that was not updated as the pregnancies proceeded to term. (https://dailyclout.io/data-do-not-support-safety-of-mrna-covid-vaccination-for-pregnant-women/, https://dailyclout.io/report-40-2021-cdc-and-fda-misinformation-retroactive-editing-erroneous-spontaneous-abortion-rate-calculation-obfuscation-in-the-new-england-journal-of-medicine/, https://pubmed.ncbi.nlm.nih.gov/2021664/%5d, https://pubmed.ncbi.nlm.nih.gov/3393170/, https://www.ncbi.nlm.nih.gov/books/NBK560521/)
Unfortunately, the rates of spontaneous abortion, stillbirth, congenital anomaly, perinatal fatality, and small gestational size could not be calculated since a suitable denominator was not available. (https://dailyclout.io/report-40-2021-cdc-and-fda-misinformation-retroactive-editing-erroneous-spontaneous-abortion-rate-calculation-obfuscation-in-the-new-england-journal-of-medicine/)
The takeaway from the Centers for Disease Control and Prevention (CDC) and Food and Drug Administration (FDA) reporting is that there was no useful surveillance of pregnant women who received the genetic therapy represented by BNT162b2, Pfizer’s mRNA COVID vaccine, and/or mRNA1273, Moderna’s mRNA COVID vaccine, that would allow determination of safety of these products during pregnancy.
The question arises as to how many American pregnant women were injected during 2021, the first full year of Emergency Use Authorization (EUA) of mRNA COVID vaccines.
What follows is an attempt to answer that question by computation, as the actual data has not been made available, if it even exists.
II: Definitions:
- FL20 = Fetal loss at 20 weeks or later, also called Stillbirth.
- LB = Live Births.
- P = Pregnancies.
- SAB = Spontaneous Abortions, also called Miscarriage, defined as spontaneous fetal loss before 20 weeks.
- SABr = Rate of Spontaneous Abortion or SAB/P
- TAB = Therapeutic Abortions; abortions that involve assistance from the medical profession and are done electively, urgently and emergently.
- TFL = Total Fetal Loss; the sum of (FL20 + SAB + TAB).
III. Calculation of the Number of Pregnancies in 2021 (See Appendix I)
Pregnancies (P) are the sum of the number of live births (LB), therapeutic abortions (TAB), spontaneous abortions (SAB), and fetal loss at 20 weeks or later (FL20):
P = LB + TAB + FL20 + SAB
Total Fetal Loss (TFL) = TAB + FL20 + SAB
\ P = LB + TFL
A. 2021 Live Births:
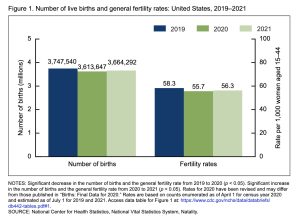
According to the CDC (https://www.cdc.gov/nchs/data/databriefs/db442.pdf), there were 3,664,292 live births in 2021, up 1% from 2020 and down 2% from 2019. Figure 1.
B. 2020 Therapeutic Abortions (TAB):
The CDC estimates the number of therapeutic abortions in 2019 as 625,346, while the Guttmacher Institute estimated the number the last year data were available in 2020 to be 930,160. (https://www.pewresearch.org/fact-tank/2022/06/24/what-the-data-says-about-abortion-in-the-u-s-2/ft_2022-06-23_abortiondata_01/)
Figure 2 displays the discrepancy between the estimates of therapeutic abortions from the CDC and the Guttmacher Institute.
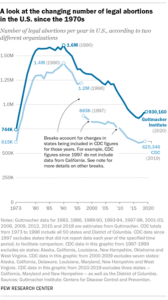
Figure 2: US TABs
This discrepancy is explained as follows:
“The Guttmacher Institute compiles its figures after contacting every known provider of abortions – clinics, hospitals and physicians’ offices – in the country. It uses questionnaires and health department data, and it provides estimates for abortion providers that don’t respond to its inquiries. In part because Guttmacher includes figures (and in some instances, estimates) from all 50 states, its totals are higher than the CDC’s.”
(https://www.guttmacher.org/united-states/abortion)
Guttmacher TAB estimates are used in this article as they are more complete than those from the CDC.
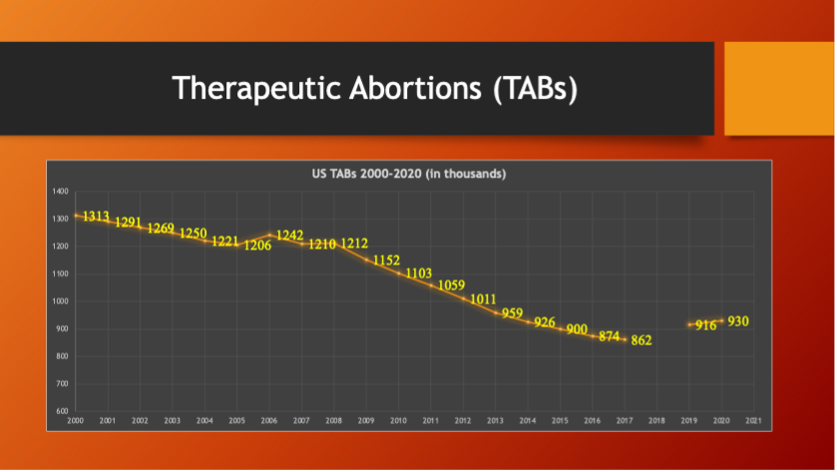
Chart 1 illustrates a 42% decline in therapeutic abortions from their peak at 1.6 million in 1990 compared with 930,000 in 2020 and 46% from the peak in 1990 to a modern low in 2017 of 862,000.
Chart 1: Decline in TABs Since 2000.
C. Fetal Loss at 20 Weeks or Later (FL20) (Stillbirths):
2020 Data from the CDC gives the FL20 as 20,854
(https://www.cdc.gov/nchs/data/nvsr/nvsr71/nvsr71-04.pdf)
D. Pregnancy and Spontaneous Abortion Calculation:
Spontaneous abortions are estimated to occur in 10 to 30 percent of pregnancies:
“Vaginal bleeding before twenty weeks of gestation occurs in up to 20% of pregnancies, and 50% of these cases will have a spontaneous abortion. Overall, 10-20% of clinically recognized pregnancies will end in early pregnancy loss. However, these statistics likely underestimate the true incidence of spontaneous abortion, as many miscarriages occur before a mother realizes she is pregnant and is simply mistaken as heavy, late menses. As a result, the true incidence of spontaneous abortion may be closer to 30%.”
(https://www.ncbi.nlm.nih.gov/books/NBK560521/)
Given the variance in reported SABr, calculations were made using 10%, 20% and 30% in estimating the number of pregnancies in 2021.
A tool (Appendix I) to calculate a value for pregnancies was developed using the following equation,
P = (LB + TAB + FL20)/(1-r)
Where r = SABr, the rate of spontaneous abortion. r values considered here are 0.1, 0.2 and 0.3 for 10%, 20% and 30%.
Chart 2: Estimated Number of Pregnancies in 2021
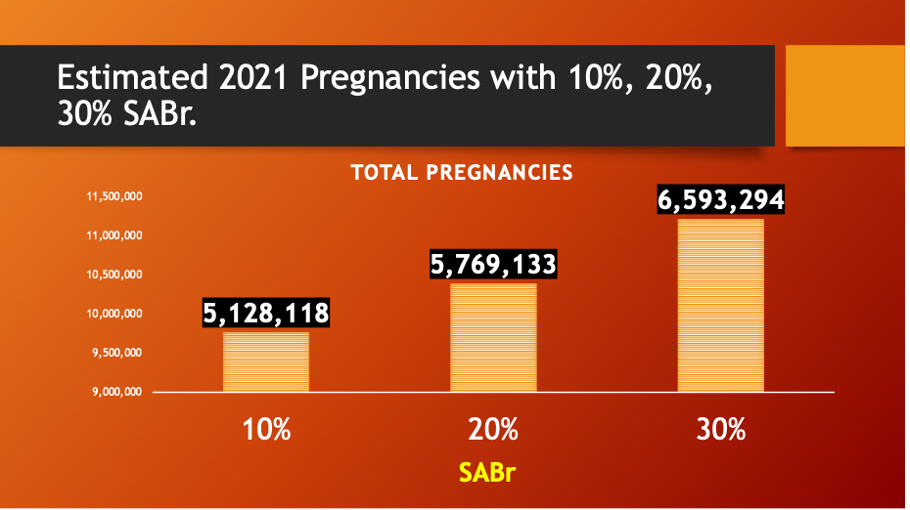
The range in the estimated number of pregnancies in 2021 is from 5,128,118 to 6,593,294. Given that the lower figure of 10% does not commonly take into account the first six weeks of gestation, the 20 to 30% range for SABr is more likely to encompass the true range of pregnancy of 5.8 to 6.6 million pregnant women in 2021 than the 10 to 20% figure that is commonly quoted. (Goldhaber, M. K., & Fireman, B. H. (1991). The fetal life table revisited: spontaneous abortion rates in three Kaiser Permanente cohorts. Epidemiology (Cambridge, Mass.), 2(1), 33–39. https://pubmed.ncbi.nlm.nih.gov/2021664. Wilcox, A. J., Weinberg, C. R., O’Connor, J. F., Baird, D. D., Schlatterer, J. P., Canfield, R. E., Armstrong, E. G., & Nisula, B. C. (1988). Incidence of early loss of pregnancy. The New England Journal of Medicine, 319(4), 189–194. https://pubmed.ncbi.nlm.nih.gov/3393170/)
This is a reasonable estimate when compared with the Guttmacher.org 2017 estimate of 5,573,550. (https://data.guttmacher.org/states/)
IV: Estimates of Pregnant Women (PW) Who Were Given LNP/mRNA in 2021
As of December 30, 2021, USA Facts provided the following numbers for the percent of the US population receiving COVID-19 gene therapy products.
| US Total Vaccines 2021: | ||
| 1 dose | 73% | 243,527,564 |
| 2 doses | 62% | 205,811,394 |
| 3 doses | 20% | 68,810,709 |
(https://usafacts.org/visualizations/covid-vaccine-tracker-states/)
The 20% and 30% estimates of SABr will be used to calculate the number of pregnant women injected with LNP/mRNA products in 2021. Appendix II gives the detail of these estimates.
Chart 3 illustrates ranges of values for rates of LNP/mRNA injection for the 20% and 30% SABr cases using 25%, 50%, and 100% of the general public rates (GPr) of inoculation.
Chart 3: All Trimesters
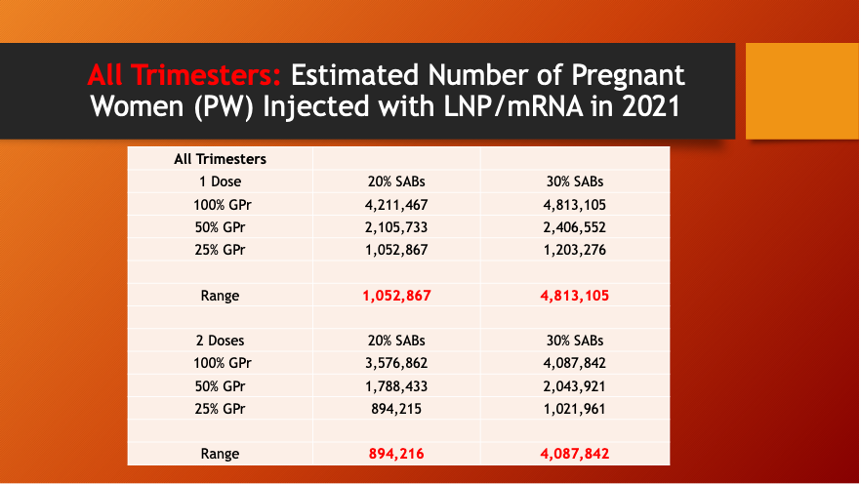
From this analysis, the estimated total number of pregnant women injected with one or two doses of LNP/mRNA during 2021 ranges from:
894,216 two doses at 25% general population vaccination rate
4,813,105 one dose at 100% of general population vaccination rate
The first trimester is the critical time when a fetus is at maximum risk for harms from various agents such as alcohol, pharmaceuticals, and radiation to give a few examples. (https://www.hopkinsmedicine.org/health/wellness-and-prevention/the-first-trimester) The first trimester case is considered in Charts 4 and 5.
Chart 4: First Trimester Estimates
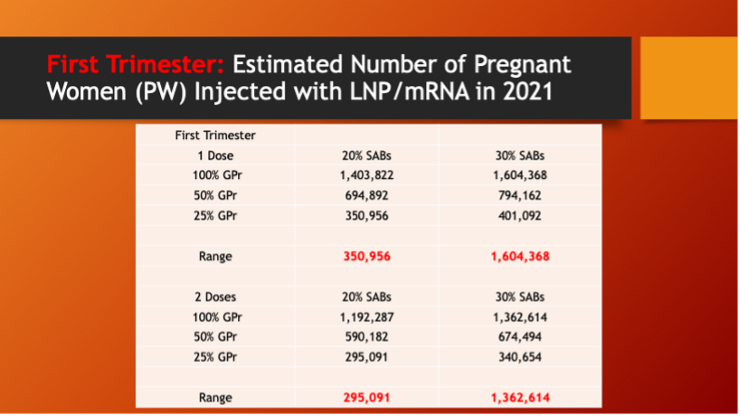
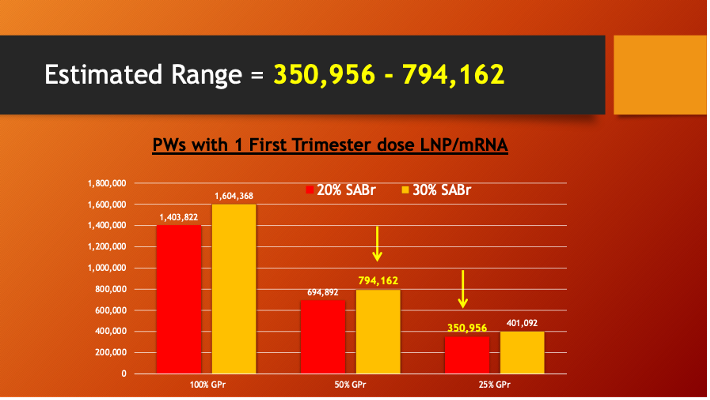
Even though no cautions were issued by government health care agencies or the medical establishment concerning first trimester injections of experimental LNP/mRNA gene products, obstetricians have historically been very cautious about recommending any medication during the first trimester of pregnancy. Therefore, the true number of pregnant women injected with at least one dose of LNP/mRNA during their first trimester is likely to have been in the mid- to lower-end of this range, 350,956 to 794,162.
Chart 5: Best Estimate of the Number of Pregnant Women Who Received One Does of LNP/mRNA During Their First Trimester
V. Discussion:
The crudeness of these estimates must be acknowledged. Some assumptions are built into this analysis that may be incorrect. Figures from 2021 will be used to update these calculations when they become available.
There is wide variation in the estimated number of pregnant women given LNP/mRNA during their pregnancies, but the potential is that as many as 4.8 million pregnant American women were injected in 2021 with at least 1 dose (see Chart 3) of LNP/mRNA during any trimester and up to 800,000 in the critical first trimester.
Unfortunately, US government health agencies have made no serious attempt to study the pregnant women who were injected with LNP/mRNA in 2021, and efforts must now be made to study the outcome of these pregnancies. (https://dailyclout.io/data-do-not-support-safety-of-mrna-covid-vaccination-for-pregnant-women/, https://dailyclout.io/report-40-2021-cdc-and-fda-misinformation-retroactive-editing-erroneous-spontaneous-abortion-rate-calculation-obfuscation-in-the-new-england-journal-of-medicine/)
Medical professionals must be surveyed to learn of the advice they gave to their pregnant patients, and the patients who received LNP/mRNA during their pregnancies must be located to determine outcomes.
At this point in time, the long-term effects of LNP/mRNA are unknown in the general population as well as in pregnant women. The latter group, however, represents a very special class, as not only are two human beings at risk but, even more profoundly if that is possible, future generations may have inherited experimental mRNA from their parents.
Already there is some evidence that synthetic mRNA can be translated into host DNA, which in turn can incorporate into the genome where it may produce a myriad of heritable and unwelcome biologic changes. (https://www.mdpi.com/1467-3045/44/3/73/htm)
In addition to the potential for generational transmission of synthetic, manmade genetic code, there are concerns over ongoing production of novel proteins that can lead to autoimmunity, the vascular disorders of clotting and embolus, dysregulation of oncogenes and cancers, myeloproliferative disorders, and the various expressions of prion disease including degenerative neurologic disease. (https://www.theepochtimes.com/health/why-spike-protein-causes-abnormal-blood-clots-200-symptoms_4842684.html, https://www.theepochtimes.com/health/more-adverse-events-its-time-to-halt-covid-vaccine-recommendations-for-pregnant-women_4824656.html, https://www.theepochtimes.com/spike-protein-in-covid-19-vaccines-triggering-cancers-and-clots-pathologist-dr-ryan-cole_4820381.html)
At this point, the damage has been done. The experiment, like a bold journey into an unknown and potentially hostile realm, has launched. The means to study the effects of these novel gene therapy products exist but have been severely suppressed by an unseen and powerful international agent that seemingly acts in its own interest and not that of humanity. Not since the era of the Third Reich has the world witnessed diabolic intent on this level.
“To a large degree, the medical profession was not politicized but politics were medicalized.”
(E. Ernst, Commentary: The Third Reich—German physicians between resistance and participation, International Journal of Epidemiology, Volume 30, Issue 1, February 2001, Pages 37–42, https://doi.org/10.1093/ije/30.1.37)
Appendix I: Calculation of Spontaneous Abortion (Miscarriage)
Definitions:
- FL20 = Fetal loss at 20 weeks or later, also called Stillbirth.
- LB = Live Births.
- P = Pregnancies.
- SAB = Spontaneous Abortions, also called Miscarriages, defined as spontaneous fetal loss before 20 weeks.
- SABr = Rate of Spontaneous Abortion or SAB/P.
- TAB = Therapeutic Abortions; abortions that involve assistance from the medical profession and are done electively, urgently and emergently.
- Total Fetal Loss; the sum of (FL20 + SAB + TAB).
P = LB + TAB + SAB + FL20
TFL = TAB + SAB + FL20
\ P = LB + TFL
Data Sources LB, TAB & FL20:
LB = 3,664,292 2021 Data from the CDC https://www.cdc.gov/nchs/data/databriefs/db442.pdf
TAB = 930,160 2020 Data from Guttmacher https://www.guttmacher.org/united-states/abortion
FL20 = 20,854 2020 Data from the CDC https://www.cdc.gov/nchs/data/nvsr/nvsr71/nvsr71-04.pdf
SAB: A consistent source for SAB has not been located. Here it is calculated as follows:
SAB = r * P
Where r is the rate of SAB or SABr.
Pregnancies are calculated as follows:
P = LB + TAB + SAB + FL20
P = LB + TAB + (r *P) + FL20
P – (r * P) = (LB + TAB + FL20)
(1-r) * P = (LB + TAB + FL20)
\ P = (LB + TAB + FL20)/(1-r)
Fetal loss does not occur linearly during gestation but rather is front-end loaded with most SABs occurring during the initial 20 weeks of gestation.
The first six weeks after conception are problematic with respect to recognizing pregnancy itself and loss of the conceptus. Measurement of hormone levels has disclosed a higher rate of miscarriage than observation alone. The range of rates miscarriage has been estimated to be 10 to 30 percent of pregnancies. https://www.ncbi.nlm.nih.gov/books/NBK560521/
Chart 6: Number of Pregnancies in 2021
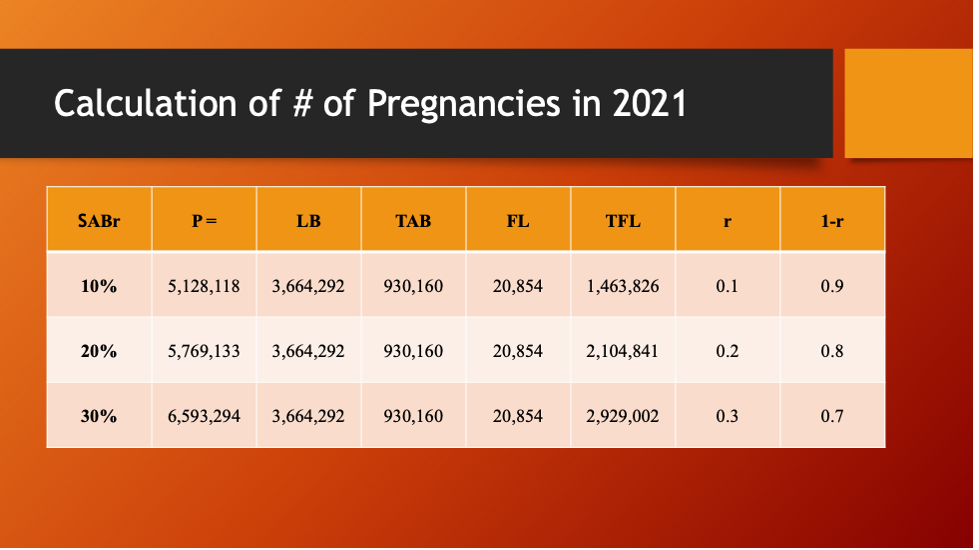
The range of estimated pregnancies in 2021 is from 5,128,118 to 6,593,294. The range of 5,769,133 to 6,593,294 is considered to more accurately account for the first six weeks, as discussed earlier, than the 10 percent rate and will be used herein.
Estimated Pregnancies in 2021 =
5.8 to 6.6 million
Appendix II: Estimated Number of Pregnant Women Injected with LNP/mRNA in 2021
The 20% and 30% SABr cases will be considered further:
| SABr = | 20% | 30% |
| P = | 5,769,133 | 6,593,294 |
| 20% SABr | |||
| 100% GPr* | % Vaxed | Total PW vaxed | Equal by Trimester |
| 1 dose | 0.73 | 4,211,467 | 1,403,822 |
| 2 doses | 0.62 | 3,576,862 | 1,192,287 |
| 3 doses | 0.20 | 1,153,827 | 384,609 |
| 50% GPr* | % Vaxed | Total PW Vaxed | Equal by Trimester |
| 1 dose | 0.37 | 2,105,733 | 694,892 |
| 2 doses | 0.31 | 1,788,431 | 590,182 |
| 3 doses | 0.10 | 576,913 | 190,381 |
| 25% GPr* | % Vaxed | Total PW Vaxed | Equal by Trimester |
| 1 dose | 0.18 | 1,052,867 | 350,956 |
| 2 doses | 0.16 | 894,216 | 295,091 |
| 3 doses | 0.05 | 288,457 | 95,191 |
*GPr = the rate of vaccination for the General Public as reported by (https://usafacts.org/visualizations/covid-vaccine-tracker-states/):
| 30% SABr | |||
| 100 % GPr* | % Vaxed | Total PW vaxed | Equal by Trimester |
| 1 dose | 0.73 | 4,813,105 | 1,604,368 |
| 2 doses | 0.62 | 4,087,842 | 1,362,614 |
| 3 doses | 0.20 | 1,318,659 | 439,553 |
| 50 % GPr* | % Vaxed | Total PW Vaxed | Equal by Trimester |
| 1 dose | 0.37 | 2,406,552 | 794,162 |
| 2 doses | 0.31 | 2,043,921 | 674,494 |
| 3 doses | 0.10 | 659,329 | 217,579 |
| 25 % GPr* | % Vaxed | Total PW Vaxed | Equal by Trimester |
| 1 dose | 0.18 | 1,203,276 | 401,092 |
| 2 doses | 0.16 | 1,021,961 | 340,654 |
| 3 doses | 0.05 | 329,665 | 108,789 |
*GPr = General Public Rate
Appendix III: Estimated Number of Pregnant Women Injected in 2021 with LNP/mRNA in the First Trimester.
| First Trimester | ||
| 1 Dose | 20% SABs | 30% SABs |
| 100% GPr* | 1,403,822 | 1,604,368 |
| 50% GPr* | 694,892 | 794,162 |
| 25% GPr* | 350,955 | 401,092 |
| Range | 350,955.56 | 1,604,368 |
|
|
||
| 2 Doses | 20% SABs | 30% SABs |
| 100% GPr* | 1,192,287 | 1,362,614 |
| 50% GPr* | 590,182 | 674,494 |
| 25% GPr* | 295,091 | 340,654 |
| Range | 295,091 | 1,362,614 |
*GPr = General Public Rate


